Estonian vs Mexican American Indian Male Disability
COMPARE
Estonian
Mexican American Indian
Male Disability
Male Disability Comparison
Estonians
Mexican American Indians
11.4%
MALE DISABILITY
26.8/ 100
METRIC RATING
188th/ 347
METRIC RANK
11.6%
MALE DISABILITY
7.8/ 100
METRIC RATING
213th/ 347
METRIC RANK
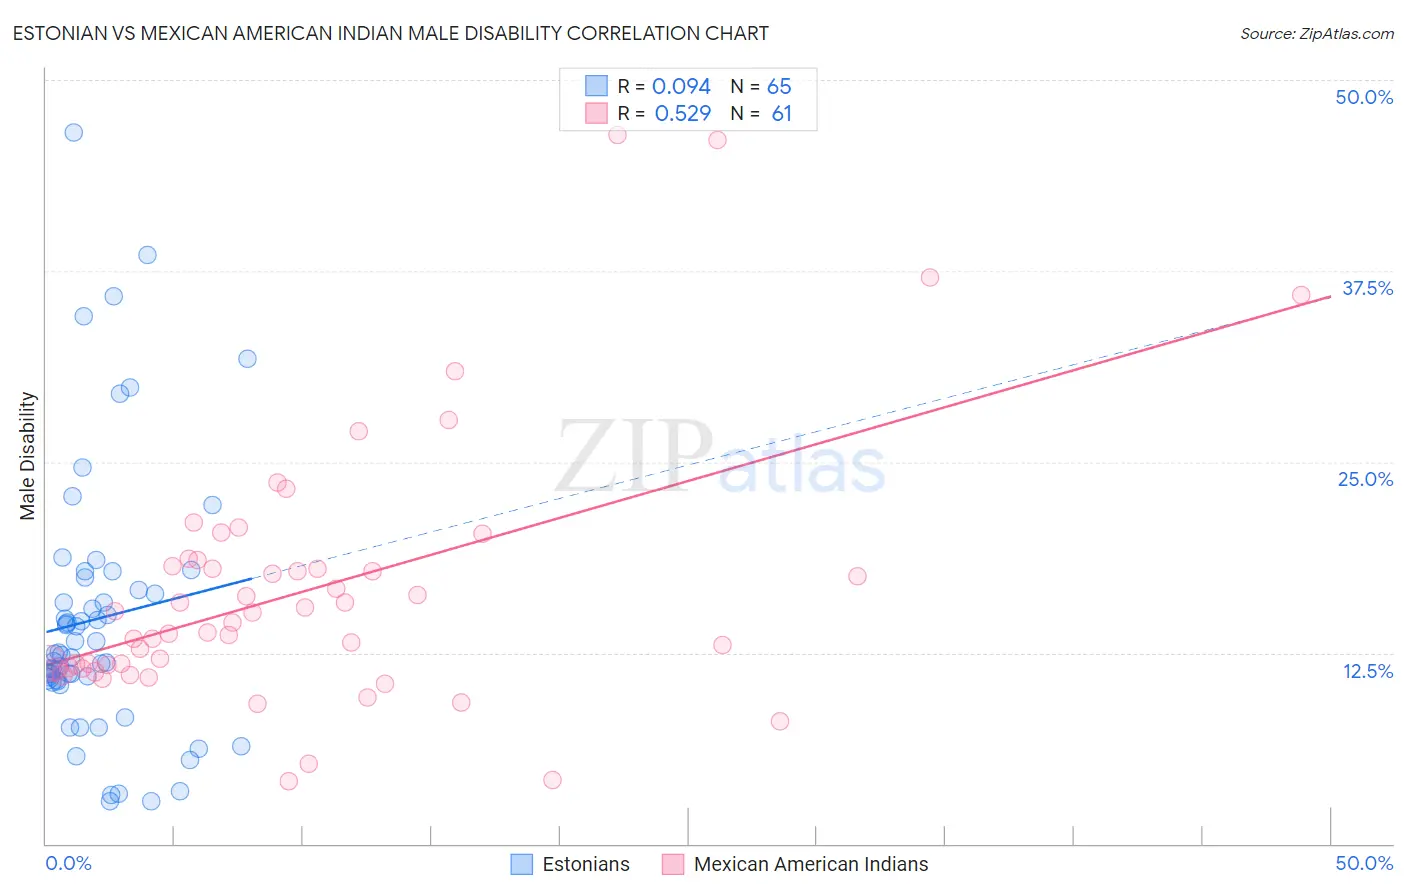
Estonian vs Mexican American Indian Male Disability Correlation Chart
The statistical analysis conducted on geographies consisting of 123,527,387 people shows a slight positive correlation between the proportion of Estonians and percentage of males with a disability in the United States with a correlation coefficient (R) of 0.094 and weighted average of 11.4%. Similarly, the statistical analysis conducted on geographies consisting of 317,563,584 people shows a substantial positive correlation between the proportion of Mexican American Indians and percentage of males with a disability in the United States with a correlation coefficient (R) of 0.529 and weighted average of 11.6%, a difference of 2.0%.
Male Disability Correlation Summary
| Measurement | Estonian | Mexican American Indian |
| Minimum | 2.8% | 4.1% |
| Maximum | 46.6% | 46.4% |
| Range | 43.8% | 42.3% |
| Mean | 14.7% | 16.6% |
| Median | 12.5% | 14.5% |
| Interquartile 25% (IQ1) | 10.7% | 11.5% |
| Interquartile 75% (IQ3) | 17.0% | 18.4% |
| Interquartile Range (IQR) | 6.3% | 6.8% |
| Standard Deviation (Sample) | 8.7% | 8.5% |
| Standard Deviation (Population) | 8.7% | 8.4% |
Similar Demographics by Male Disability
Demographics Similar to Estonians by Male Disability
In terms of male disability, the demographic groups most similar to Estonians are Immigrants from Austria (11.4%, a difference of 0.040%), Immigrants from Zaire (11.4%, a difference of 0.060%), Immigrants from Netherlands (11.4%, a difference of 0.060%), Immigrants from Bosnia and Herzegovina (11.4%, a difference of 0.10%), and Pakistani (11.3%, a difference of 0.24%).
| Demographics | Rating | Rank | Male Disability |
| Immigrants | Senegal | 34.4 /100 | #181 | Fair 11.3% |
| Immigrants | Belize | 33.7 /100 | #182 | Fair 11.3% |
| Immigrants | Central America | 32.9 /100 | #183 | Fair 11.3% |
| Iraqis | 30.5 /100 | #184 | Fair 11.3% |
| Pakistanis | 30.3 /100 | #185 | Fair 11.3% |
| Immigrants | Zaire | 27.6 /100 | #186 | Fair 11.4% |
| Immigrants | Austria | 27.3 /100 | #187 | Fair 11.4% |
| Estonians | 26.8 /100 | #188 | Fair 11.4% |
| Immigrants | Netherlands | 25.9 /100 | #189 | Fair 11.4% |
| Immigrants | Bosnia and Herzegovina | 25.4 /100 | #190 | Fair 11.4% |
| Senegalese | 23.2 /100 | #191 | Fair 11.4% |
| Assyrians/Chaldeans/Syriacs | 23.2 /100 | #192 | Fair 11.4% |
| Greeks | 22.2 /100 | #193 | Fair 11.4% |
| Belizeans | 21.2 /100 | #194 | Fair 11.4% |
| Immigrants | Oceania | 20.9 /100 | #195 | Fair 11.4% |
Demographics Similar to Mexican American Indians by Male Disability
In terms of male disability, the demographic groups most similar to Mexican American Indians are Immigrants from Scotland (11.6%, a difference of 0.080%), Immigrants from Thailand (11.6%, a difference of 0.10%), Lithuanian (11.6%, a difference of 0.24%), Ute (11.6%, a difference of 0.28%), and Spanish American Indian (11.6%, a difference of 0.37%).
| Demographics | Rating | Rank | Male Disability |
| Ukrainians | 10.6 /100 | #206 | Poor 11.5% |
| Immigrants | Somalia | 10.4 /100 | #207 | Poor 11.5% |
| Icelanders | 10.1 /100 | #208 | Poor 11.6% |
| Spanish American Indians | 10.1 /100 | #209 | Poor 11.6% |
| Ute | 9.4 /100 | #210 | Tragic 11.6% |
| Immigrants | Thailand | 8.4 /100 | #211 | Tragic 11.6% |
| Immigrants | Scotland | 8.2 /100 | #212 | Tragic 11.6% |
| Mexican American Indians | 7.8 /100 | #213 | Tragic 11.6% |
| Lithuanians | 6.6 /100 | #214 | Tragic 11.6% |
| Indonesians | 5.9 /100 | #215 | Tragic 11.6% |
| Immigrants | Dominican Republic | 4.9 /100 | #216 | Tragic 11.7% |
| Immigrants | Dominica | 4.6 /100 | #217 | Tragic 11.7% |
| Immigrants | England | 4.0 /100 | #218 | Tragic 11.7% |
| Panamanians | 3.8 /100 | #219 | Tragic 11.7% |
| Immigrants | Western Europe | 3.8 /100 | #220 | Tragic 11.7% |