Laotian vs Crow Hearing Disability
COMPARE
Laotian
Crow
Hearing Disability
Hearing Disability Comparison
Laotians
Crow
2.9%
HEARING DISABILITY
81.1/ 100
METRIC RATING
142nd/ 347
METRIC RANK
4.2%
HEARING DISABILITY
0.0/ 100
METRIC RATING
329th/ 347
METRIC RANK
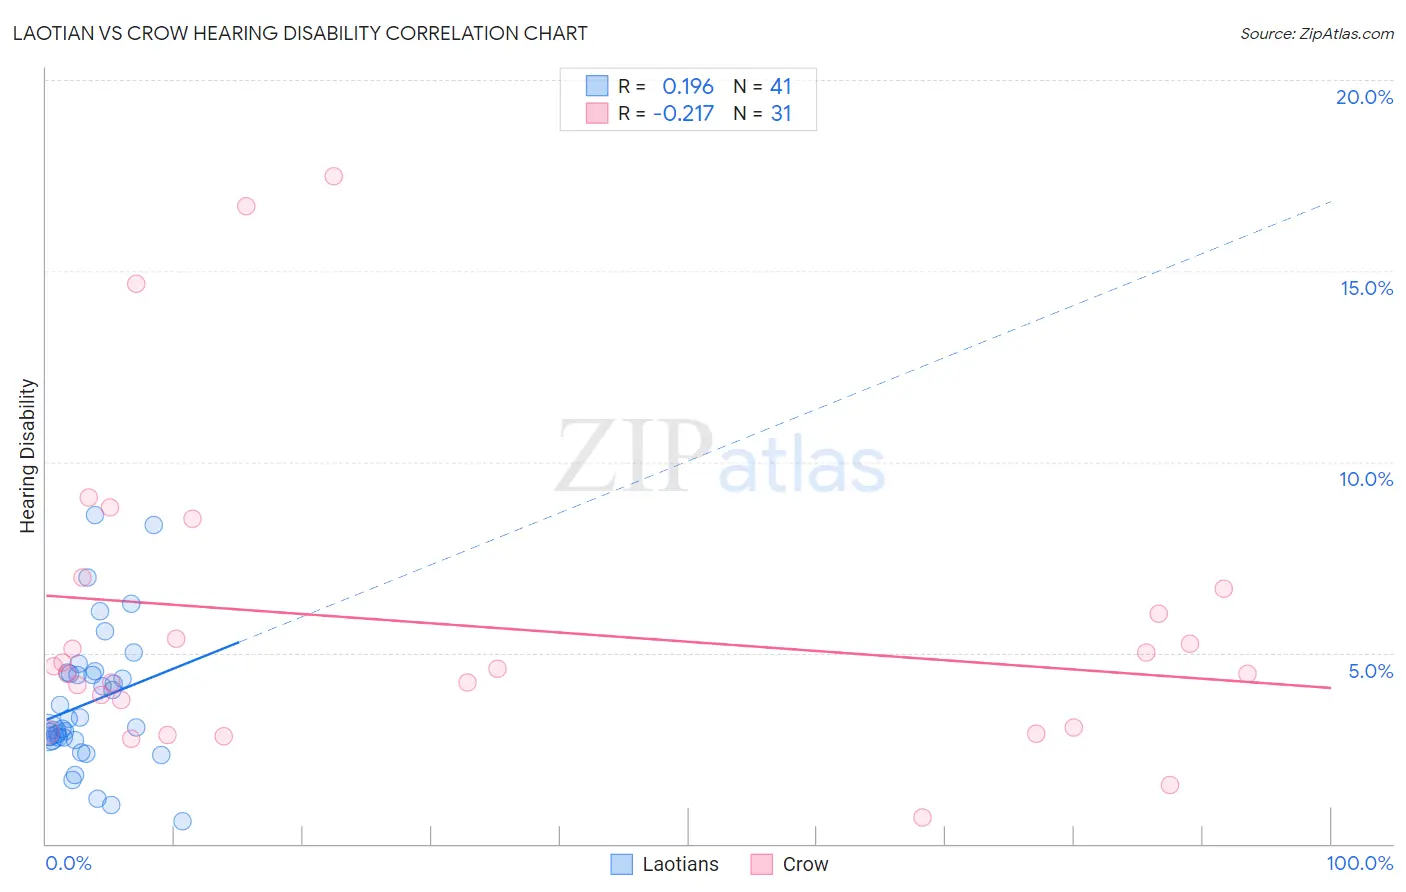
Laotian vs Crow Hearing Disability Correlation Chart
The statistical analysis conducted on geographies consisting of 224,832,654 people shows a poor positive correlation between the proportion of Laotians and percentage of population with hearing disability in the United States with a correlation coefficient (R) of 0.196 and weighted average of 2.9%. Similarly, the statistical analysis conducted on geographies consisting of 59,194,968 people shows a weak negative correlation between the proportion of Crow and percentage of population with hearing disability in the United States with a correlation coefficient (R) of -0.217 and weighted average of 4.2%, a difference of 44.0%.
Hearing Disability Correlation Summary
| Measurement | Laotian | Crow |
| Minimum | 0.57% | 0.69% |
| Maximum | 8.6% | 17.5% |
| Range | 8.0% | 16.8% |
| Mean | 3.7% | 5.7% |
| Median | 3.1% | 4.6% |
| Interquartile 25% (IQ1) | 2.7% | 3.1% |
| Interquartile 75% (IQ3) | 4.5% | 6.7% |
| Interquartile Range (IQR) | 1.7% | 3.6% |
| Standard Deviation (Sample) | 1.8% | 4.0% |
| Standard Deviation (Population) | 1.7% | 3.9% |
Similar Demographics by Hearing Disability
Demographics Similar to Laotians by Hearing Disability
In terms of hearing disability, the demographic groups most similar to Laotians are Immigrants from Bahamas (2.9%, a difference of 0.020%), Immigrants from Bulgaria (2.9%, a difference of 0.29%), Immigrants from Congo (2.9%, a difference of 0.34%), Brazilian (2.9%, a difference of 0.36%), and Subsaharan African (2.9%, a difference of 0.37%).
| Demographics | Rating | Rank | Hearing Disability |
| Soviet Union | 84.8 /100 | #135 | Excellent 2.9% |
| Immigrants | Brazil | 84.6 /100 | #136 | Excellent 2.9% |
| Sri Lankans | 84.1 /100 | #137 | Excellent 2.9% |
| Immigrants | Costa Rica | 84.0 /100 | #138 | Excellent 2.9% |
| Bermudans | 83.8 /100 | #139 | Excellent 2.9% |
| Immigrants | Jordan | 83.7 /100 | #140 | Excellent 2.9% |
| Sub-Saharan Africans | 83.3 /100 | #141 | Excellent 2.9% |
| Laotians | 81.1 /100 | #142 | Excellent 2.9% |
| Immigrants | Bahamas | 80.9 /100 | #143 | Excellent 2.9% |
| Immigrants | Bulgaria | 79.2 /100 | #144 | Good 2.9% |
| Immigrants | Congo | 78.9 /100 | #145 | Good 2.9% |
| Brazilians | 78.7 /100 | #146 | Good 2.9% |
| Tongans | 78.6 /100 | #147 | Good 2.9% |
| Immigrants | Russia | 77.7 /100 | #148 | Good 2.9% |
| Immigrants | Panama | 76.9 /100 | #149 | Good 2.9% |
Demographics Similar to Crow by Hearing Disability
In terms of hearing disability, the demographic groups most similar to Crow are Tohono O'odham (4.2%, a difference of 0.010%), Arapaho (4.1%, a difference of 0.39%), Native/Alaskan (4.2%, a difference of 0.79%), Cherokee (4.2%, a difference of 0.94%), and Potawatomi (4.1%, a difference of 1.1%).
| Demographics | Rating | Rank | Hearing Disability |
| Seminole | 0.0 /100 | #322 | Tragic 4.1% |
| Apache | 0.0 /100 | #323 | Tragic 4.1% |
| Osage | 0.0 /100 | #324 | Tragic 4.1% |
| Lumbee | 0.0 /100 | #325 | Tragic 4.1% |
| Potawatomi | 0.0 /100 | #326 | Tragic 4.1% |
| Arapaho | 0.0 /100 | #327 | Tragic 4.1% |
| Tohono O'odham | 0.0 /100 | #328 | Tragic 4.2% |
| Crow | 0.0 /100 | #329 | Tragic 4.2% |
| Natives/Alaskans | 0.0 /100 | #330 | Tragic 4.2% |
| Cherokee | 0.0 /100 | #331 | Tragic 4.2% |
| Houma | 0.0 /100 | #332 | Tragic 4.2% |
| Dutch West Indians | 0.0 /100 | #333 | Tragic 4.3% |
| Aleuts | 0.0 /100 | #334 | Tragic 4.3% |
| Kiowa | 0.0 /100 | #335 | Tragic 4.3% |
| Creek | 0.0 /100 | #336 | Tragic 4.4% |