Laotian vs Immigrants from Canada Hearing Disability
COMPARE
Laotian
Immigrants from Canada
Hearing Disability
Hearing Disability Comparison
Laotians
Immigrants from Canada
2.9%
HEARING DISABILITY
81.1/ 100
METRIC RATING
142nd/ 347
METRIC RANK
3.5%
HEARING DISABILITY
0.1/ 100
METRIC RATING
263rd/ 347
METRIC RANK
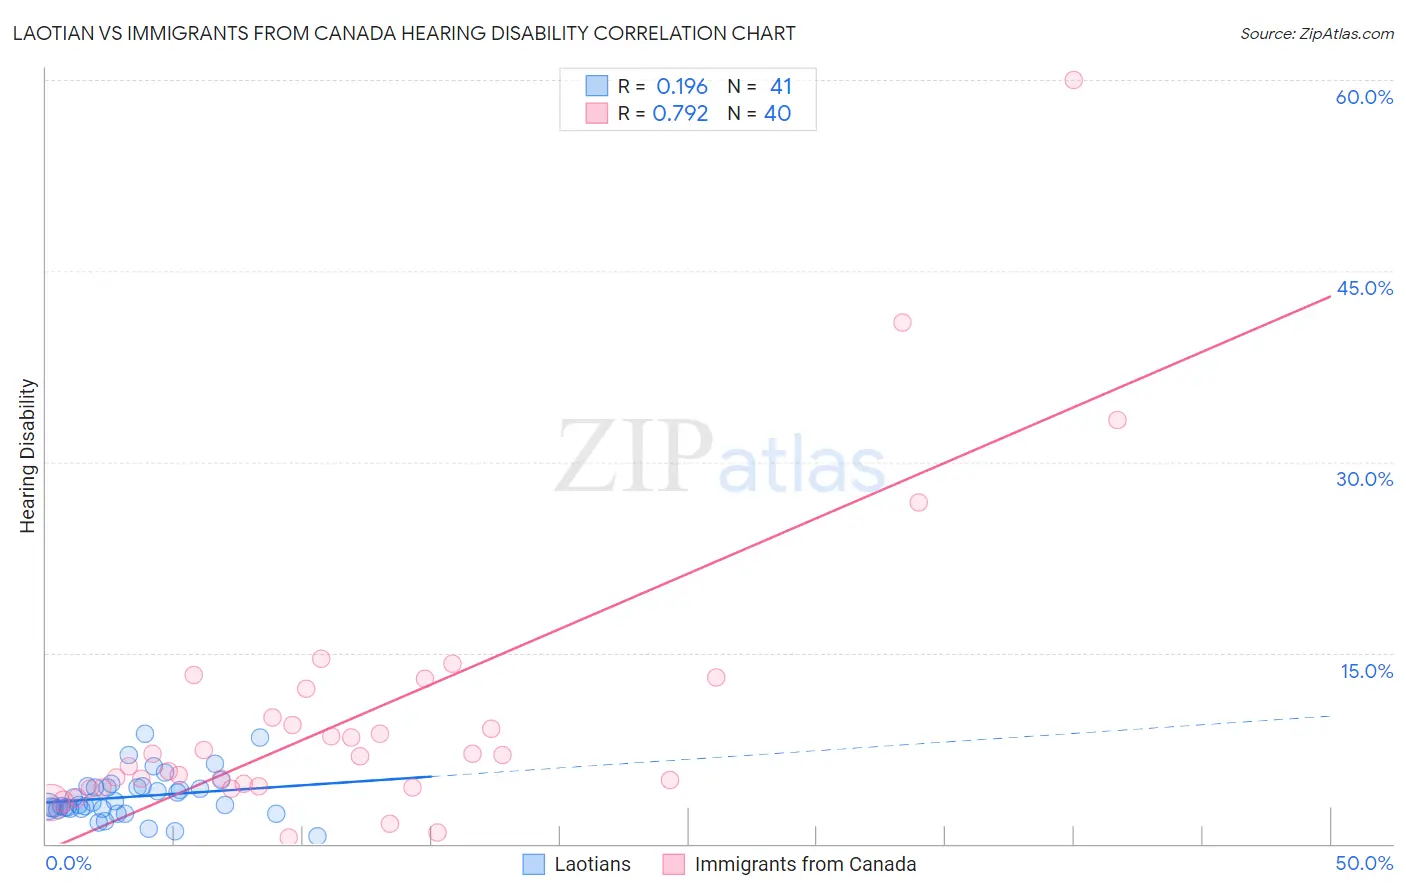
Laotian vs Immigrants from Canada Hearing Disability Correlation Chart
The statistical analysis conducted on geographies consisting of 224,832,654 people shows a poor positive correlation between the proportion of Laotians and percentage of population with hearing disability in the United States with a correlation coefficient (R) of 0.196 and weighted average of 2.9%. Similarly, the statistical analysis conducted on geographies consisting of 459,215,388 people shows a strong positive correlation between the proportion of Immigrants from Canada and percentage of population with hearing disability in the United States with a correlation coefficient (R) of 0.792 and weighted average of 3.5%, a difference of 19.8%.
Hearing Disability Correlation Summary
| Measurement | Laotian | Immigrants from Canada |
| Minimum | 0.57% | 0.49% |
| Maximum | 8.6% | 60.0% |
| Range | 8.0% | 59.5% |
| Mean | 3.7% | 10.2% |
| Median | 3.1% | 7.0% |
| Interquartile 25% (IQ1) | 2.7% | 4.5% |
| Interquartile 75% (IQ3) | 4.5% | 11.0% |
| Interquartile Range (IQR) | 1.7% | 6.6% |
| Standard Deviation (Sample) | 1.8% | 11.5% |
| Standard Deviation (Population) | 1.7% | 11.3% |
Similar Demographics by Hearing Disability
Demographics Similar to Laotians by Hearing Disability
In terms of hearing disability, the demographic groups most similar to Laotians are Immigrants from Bahamas (2.9%, a difference of 0.020%), Immigrants from Bulgaria (2.9%, a difference of 0.29%), Immigrants from Congo (2.9%, a difference of 0.34%), Brazilian (2.9%, a difference of 0.36%), and Subsaharan African (2.9%, a difference of 0.37%).
| Demographics | Rating | Rank | Hearing Disability |
| Soviet Union | 84.8 /100 | #135 | Excellent 2.9% |
| Immigrants | Brazil | 84.6 /100 | #136 | Excellent 2.9% |
| Sri Lankans | 84.1 /100 | #137 | Excellent 2.9% |
| Immigrants | Costa Rica | 84.0 /100 | #138 | Excellent 2.9% |
| Bermudans | 83.8 /100 | #139 | Excellent 2.9% |
| Immigrants | Jordan | 83.7 /100 | #140 | Excellent 2.9% |
| Sub-Saharan Africans | 83.3 /100 | #141 | Excellent 2.9% |
| Laotians | 81.1 /100 | #142 | Excellent 2.9% |
| Immigrants | Bahamas | 80.9 /100 | #143 | Excellent 2.9% |
| Immigrants | Bulgaria | 79.2 /100 | #144 | Good 2.9% |
| Immigrants | Congo | 78.9 /100 | #145 | Good 2.9% |
| Brazilians | 78.7 /100 | #146 | Good 2.9% |
| Tongans | 78.6 /100 | #147 | Good 2.9% |
| Immigrants | Russia | 77.7 /100 | #148 | Good 2.9% |
| Immigrants | Panama | 76.9 /100 | #149 | Good 2.9% |
Demographics Similar to Immigrants from Canada by Hearing Disability
In terms of hearing disability, the demographic groups most similar to Immigrants from Canada are Immigrants from North America (3.5%, a difference of 0.040%), Hawaiian (3.5%, a difference of 0.16%), Portuguese (3.5%, a difference of 0.19%), Immigrants from Germany (3.5%, a difference of 0.22%), and British (3.5%, a difference of 0.24%).
| Demographics | Rating | Rank | Hearing Disability |
| Hmong | 0.2 /100 | #256 | Tragic 3.4% |
| Yaqui | 0.2 /100 | #257 | Tragic 3.4% |
| Northern Europeans | 0.2 /100 | #258 | Tragic 3.4% |
| Slovenes | 0.1 /100 | #259 | Tragic 3.5% |
| Portuguese | 0.1 /100 | #260 | Tragic 3.5% |
| Hawaiians | 0.1 /100 | #261 | Tragic 3.5% |
| Immigrants | North America | 0.1 /100 | #262 | Tragic 3.5% |
| Immigrants | Canada | 0.1 /100 | #263 | Tragic 3.5% |
| Immigrants | Germany | 0.1 /100 | #264 | Tragic 3.5% |
| British | 0.1 /100 | #265 | Tragic 3.5% |
| Belgians | 0.1 /100 | #266 | Tragic 3.5% |
| Canadians | 0.1 /100 | #267 | Tragic 3.5% |
| Spaniards | 0.1 /100 | #268 | Tragic 3.5% |
| Ute | 0.1 /100 | #269 | Tragic 3.5% |
| Europeans | 0.1 /100 | #270 | Tragic 3.5% |