Israeli vs Immigrants from Ukraine Female Disability
COMPARE
Israeli
Immigrants from Ukraine
Female Disability
Female Disability Comparison
Israelis
Immigrants from Ukraine
11.2%
FEMALE DISABILITY
100.0/ 100
METRIC RATING
42nd/ 347
METRIC RANK
12.1%
FEMALE DISABILITY
64.3/ 100
METRIC RATING
162nd/ 347
METRIC RANK
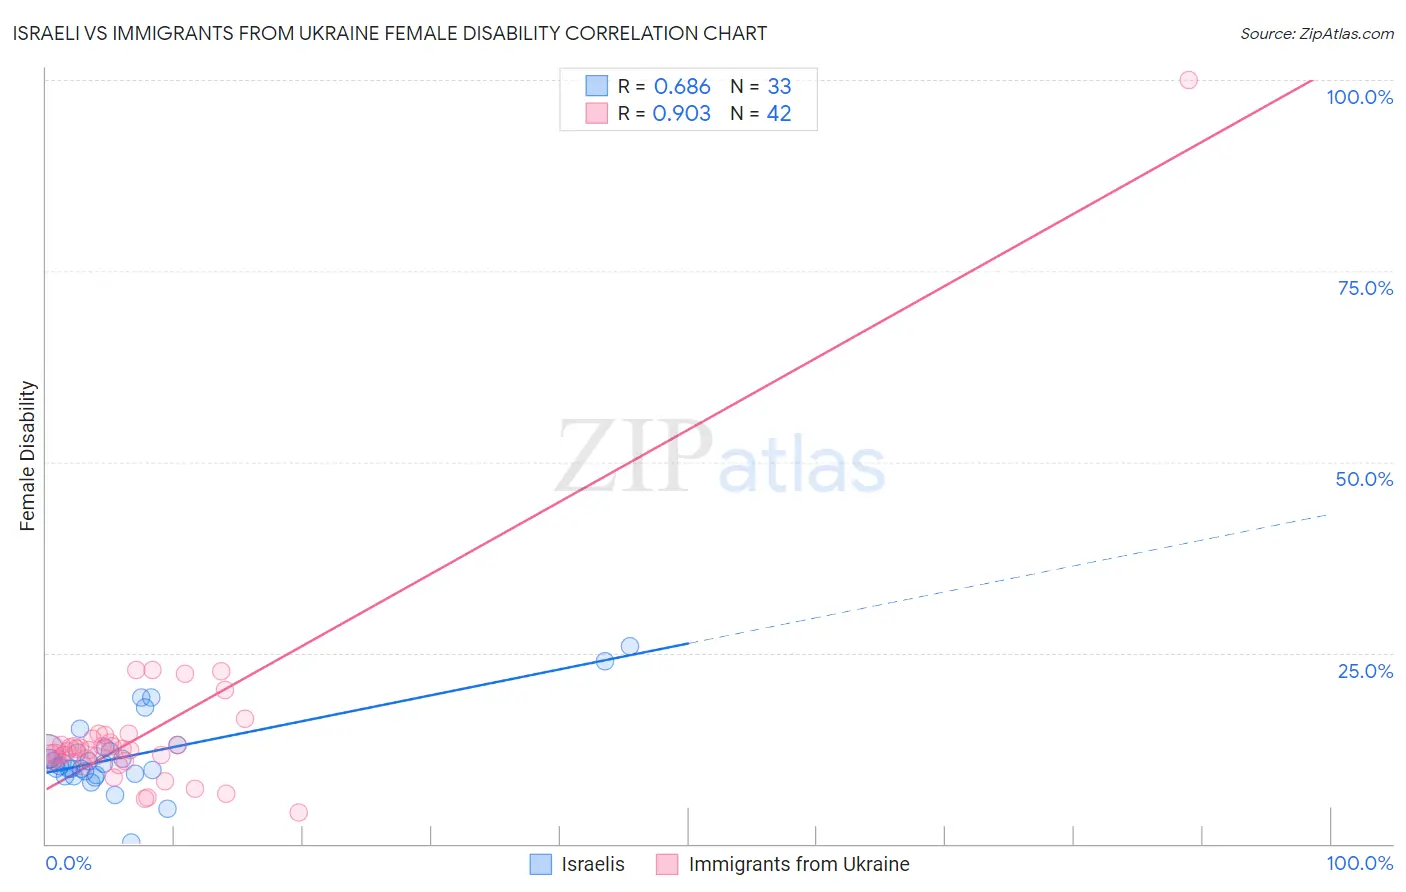
Israeli vs Immigrants from Ukraine Female Disability Correlation Chart
The statistical analysis conducted on geographies consisting of 211,173,315 people shows a significant positive correlation between the proportion of Israelis and percentage of females with a disability in the United States with a correlation coefficient (R) of 0.686 and weighted average of 11.2%. Similarly, the statistical analysis conducted on geographies consisting of 289,686,189 people shows a near-perfect positive correlation between the proportion of Immigrants from Ukraine and percentage of females with a disability in the United States with a correlation coefficient (R) of 0.903 and weighted average of 12.1%, a difference of 7.9%.
Female Disability Correlation Summary
| Measurement | Israeli | Immigrants from Ukraine |
| Minimum | 0.17% | 4.1% |
| Maximum | 25.9% | 100.0% |
| Range | 25.8% | 95.9% |
| Mean | 11.5% | 14.7% |
| Median | 10.5% | 12.4% |
| Interquartile 25% (IQ1) | 9.1% | 11.1% |
| Interquartile 75% (IQ3) | 12.3% | 13.7% |
| Interquartile Range (IQR) | 3.2% | 2.6% |
| Standard Deviation (Sample) | 5.0% | 14.2% |
| Standard Deviation (Population) | 4.9% | 14.0% |
Similar Demographics by Female Disability
Demographics Similar to Israelis by Female Disability
In terms of female disability, the demographic groups most similar to Israelis are Afghan (11.2%, a difference of 0.030%), Paraguayan (11.2%, a difference of 0.10%), Mongolian (11.2%, a difference of 0.11%), Immigrants from Lithuania (11.2%, a difference of 0.15%), and Cambodian (11.3%, a difference of 0.22%).
| Demographics | Rating | Rank | Female Disability |
| Immigrants | Japan | 100.0 /100 | #35 | Exceptional 11.2% |
| Cypriots | 100.0 /100 | #36 | Exceptional 11.2% |
| Ethiopians | 100.0 /100 | #37 | Exceptional 11.2% |
| Immigrants | Ethiopia | 100.0 /100 | #38 | Exceptional 11.2% |
| Immigrants | Lithuania | 100.0 /100 | #39 | Exceptional 11.2% |
| Mongolians | 100.0 /100 | #40 | Exceptional 11.2% |
| Paraguayans | 100.0 /100 | #41 | Exceptional 11.2% |
| Israelis | 100.0 /100 | #42 | Exceptional 11.2% |
| Afghans | 100.0 /100 | #43 | Exceptional 11.2% |
| Cambodians | 100.0 /100 | #44 | Exceptional 11.3% |
| Immigrants | Sweden | 100.0 /100 | #45 | Exceptional 11.3% |
| Immigrants | Nepal | 100.0 /100 | #46 | Exceptional 11.3% |
| Jordanians | 100.0 /100 | #47 | Exceptional 11.3% |
| Zimbabweans | 100.0 /100 | #48 | Exceptional 11.3% |
| Tongans | 100.0 /100 | #49 | Exceptional 11.3% |
Demographics Similar to Immigrants from Ukraine by Female Disability
In terms of female disability, the demographic groups most similar to Immigrants from Ukraine are Guyanese (12.1%, a difference of 0.010%), Guatemalan (12.1%, a difference of 0.020%), Czech (12.1%, a difference of 0.030%), Immigrants from Guatemala (12.1%, a difference of 0.070%), and Immigrants from Oceania (12.1%, a difference of 0.10%).
| Demographics | Rating | Rank | Female Disability |
| Ghanaians | 76.6 /100 | #155 | Good 12.1% |
| Moroccans | 72.9 /100 | #156 | Good 12.1% |
| Danes | 72.5 /100 | #157 | Good 12.1% |
| Immigrants | Middle Africa | 72.4 /100 | #158 | Good 12.1% |
| Immigrants | Central America | 67.7 /100 | #159 | Good 12.1% |
| Immigrants | Guatemala | 66.0 /100 | #160 | Good 12.1% |
| Guyanese | 64.7 /100 | #161 | Good 12.1% |
| Immigrants | Ukraine | 64.3 /100 | #162 | Good 12.1% |
| Guatemalans | 63.8 /100 | #163 | Good 12.1% |
| Czechs | 63.6 /100 | #164 | Good 12.1% |
| Immigrants | Oceania | 61.8 /100 | #165 | Good 12.1% |
| Lithuanians | 59.5 /100 | #166 | Average 12.2% |
| Immigrants | Latin America | 59.0 /100 | #167 | Average 12.2% |
| Immigrants | Haiti | 58.8 /100 | #168 | Average 12.2% |
| Lebanese | 58.1 /100 | #169 | Average 12.2% |