Iraqi vs Armenian Disability
COMPARE
Iraqi
Armenian
Disability
Disability Comparison
Iraqis
Armenians
11.8%
DISABILITY
30.0/ 100
METRIC RATING
184th/ 347
METRIC RANK
11.6%
DISABILITY
65.9/ 100
METRIC RATING
158th/ 347
METRIC RANK
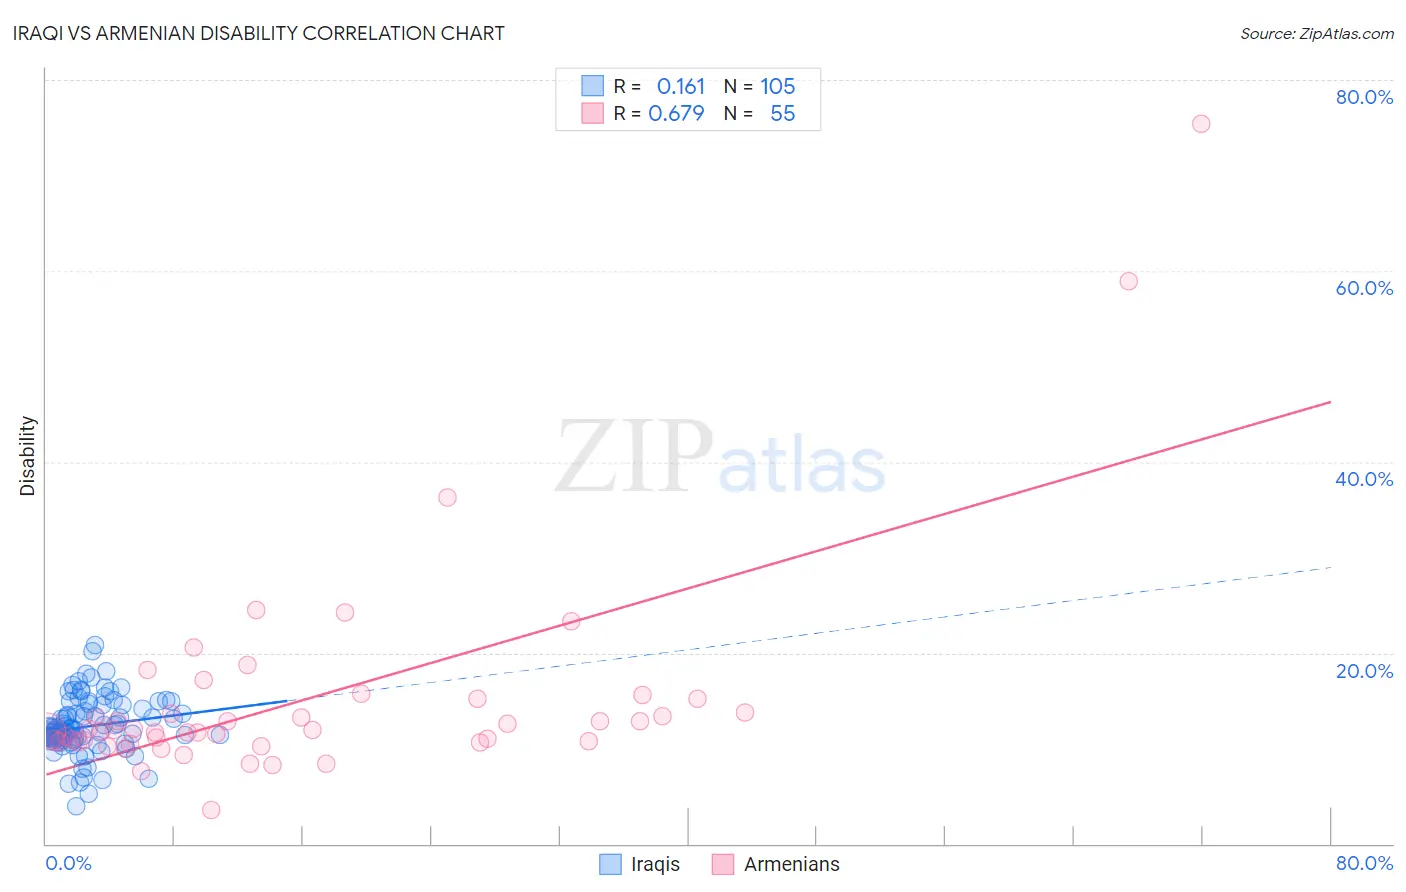
Iraqi vs Armenian Disability Correlation Chart
The statistical analysis conducted on geographies consisting of 170,650,959 people shows a poor positive correlation between the proportion of Iraqis and percentage of population with a disability in the United States with a correlation coefficient (R) of 0.161 and weighted average of 11.8%. Similarly, the statistical analysis conducted on geographies consisting of 310,943,195 people shows a significant positive correlation between the proportion of Armenians and percentage of population with a disability in the United States with a correlation coefficient (R) of 0.679 and weighted average of 11.6%, a difference of 1.7%.
Disability Correlation Summary
| Measurement | Iraqi | Armenian |
| Minimum | 3.9% | 3.6% |
| Maximum | 20.8% | 75.4% |
| Range | 16.9% | 71.8% |
| Mean | 12.3% | 15.1% |
| Median | 11.8% | 11.9% |
| Interquartile 25% (IQ1) | 11.0% | 10.7% |
| Interquartile 75% (IQ3) | 14.0% | 15.1% |
| Interquartile Range (IQR) | 3.0% | 4.4% |
| Standard Deviation (Sample) | 2.9% | 11.5% |
| Standard Deviation (Population) | 2.9% | 11.4% |
Similar Demographics by Disability
Demographics Similar to Iraqis by Disability
In terms of disability, the demographic groups most similar to Iraqis are Honduran (11.8%, a difference of 0.060%), Immigrants from Burma/Myanmar (11.8%, a difference of 0.080%), Immigrants from Scotland (11.8%, a difference of 0.090%), Lebanese (11.8%, a difference of 0.11%), and Icelander (11.8%, a difference of 0.20%).
| Demographics | Rating | Rank | Disability |
| Immigrants | Central America | 46.6 /100 | #177 | Average 11.7% |
| Greeks | 46.2 /100 | #178 | Average 11.7% |
| Immigrants | Armenia | 41.9 /100 | #179 | Average 11.7% |
| Immigrants | Honduras | 37.8 /100 | #180 | Fair 11.8% |
| Immigrants | Oceania | 34.3 /100 | #181 | Fair 11.8% |
| Icelanders | 34.0 /100 | #182 | Fair 11.8% |
| Hondurans | 31.2 /100 | #183 | Fair 11.8% |
| Iraqis | 30.0 /100 | #184 | Fair 11.8% |
| Immigrants | Burma/Myanmar | 28.5 /100 | #185 | Fair 11.8% |
| Immigrants | Scotland | 28.2 /100 | #186 | Fair 11.8% |
| Lebanese | 27.9 /100 | #187 | Fair 11.8% |
| Immigrants | Mexico | 23.8 /100 | #188 | Fair 11.9% |
| Immigrants | Zaire | 21.8 /100 | #189 | Fair 11.9% |
| Immigrants | West Indies | 21.1 /100 | #190 | Fair 11.9% |
| Ute | 19.5 /100 | #191 | Poor 11.9% |
Demographics Similar to Armenians by Disability
In terms of disability, the demographic groups most similar to Armenians are Guatemalan (11.6%, a difference of 0.040%), Immigrants from Barbados (11.6%, a difference of 0.080%), Immigrants from Cuba (11.6%, a difference of 0.15%), Immigrants from Middle Africa (11.6%, a difference of 0.18%), and Immigrants from Fiji (11.6%, a difference of 0.19%).
| Demographics | Rating | Rank | Disability |
| Immigrants | Kenya | 72.1 /100 | #151 | Good 11.6% |
| Immigrants | Moldova | 72.0 /100 | #152 | Good 11.6% |
| Immigrants | Ghana | 71.2 /100 | #153 | Good 11.6% |
| Immigrants | Guatemala | 71.1 /100 | #154 | Good 11.6% |
| Immigrants | Netherlands | 69.8 /100 | #155 | Good 11.6% |
| Immigrants | Fiji | 69.5 /100 | #156 | Good 11.6% |
| Immigrants | Middle Africa | 69.5 /100 | #157 | Good 11.6% |
| Armenians | 65.9 /100 | #158 | Good 11.6% |
| Guatemalans | 65.1 /100 | #159 | Good 11.6% |
| Immigrants | Barbados | 64.2 /100 | #160 | Good 11.6% |
| Immigrants | Cuba | 62.8 /100 | #161 | Good 11.6% |
| Immigrants | Haiti | 59.2 /100 | #162 | Average 11.7% |
| Immigrants | Trinidad and Tobago | 58.9 /100 | #163 | Average 11.7% |
| Syrians | 58.5 /100 | #164 | Average 11.7% |
| Cubans | 56.7 /100 | #165 | Average 11.7% |