Immigrants from Israel vs Armenian Disability
COMPARE
Immigrants from Israel
Armenian
Disability
Disability Comparison
Immigrants from Israel
Armenians
10.1%
DISABILITY
100.0/ 100
METRIC RATING
12th/ 347
METRIC RANK
11.6%
DISABILITY
65.9/ 100
METRIC RATING
158th/ 347
METRIC RANK
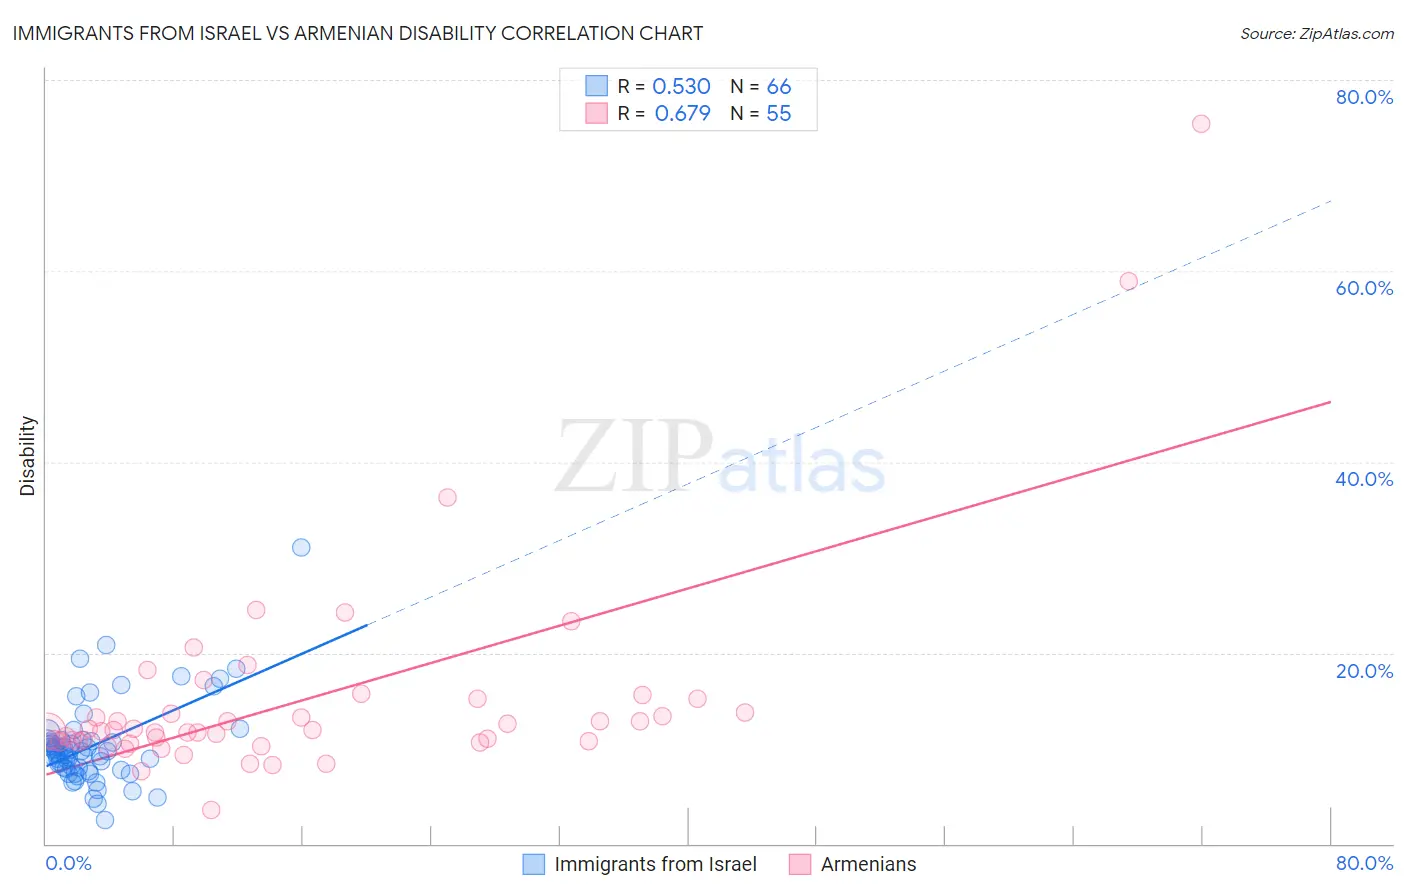
Immigrants from Israel vs Armenian Disability Correlation Chart
The statistical analysis conducted on geographies consisting of 210,034,302 people shows a substantial positive correlation between the proportion of Immigrants from Israel and percentage of population with a disability in the United States with a correlation coefficient (R) of 0.530 and weighted average of 10.1%. Similarly, the statistical analysis conducted on geographies consisting of 310,943,195 people shows a significant positive correlation between the proportion of Armenians and percentage of population with a disability in the United States with a correlation coefficient (R) of 0.679 and weighted average of 11.6%, a difference of 14.5%.
Disability Correlation Summary
| Measurement | Immigrants from Israel | Armenian |
| Minimum | 2.4% | 3.6% |
| Maximum | 31.0% | 75.4% |
| Range | 28.5% | 71.8% |
| Mean | 10.3% | 15.1% |
| Median | 9.5% | 11.9% |
| Interquartile 25% (IQ1) | 7.8% | 10.7% |
| Interquartile 75% (IQ3) | 10.8% | 15.1% |
| Interquartile Range (IQR) | 3.0% | 4.4% |
| Standard Deviation (Sample) | 4.5% | 11.5% |
| Standard Deviation (Population) | 4.4% | 11.4% |
Similar Demographics by Disability
Demographics Similar to Immigrants from Israel by Disability
In terms of disability, the demographic groups most similar to Immigrants from Israel are Immigrants from Eastern Asia (10.2%, a difference of 0.21%), Iranian (10.1%, a difference of 0.25%), Immigrants from China (10.1%, a difference of 0.26%), Immigrants from Korea (10.2%, a difference of 0.81%), and Immigrants from Hong Kong (10.0%, a difference of 1.1%).
| Demographics | Rating | Rank | Disability |
| Immigrants | Bolivia | 100.0 /100 | #5 | Exceptional 9.9% |
| Immigrants | South Central Asia | 100.0 /100 | #6 | Exceptional 9.9% |
| Immigrants | Singapore | 100.0 /100 | #7 | Exceptional 10.0% |
| Bolivians | 100.0 /100 | #8 | Exceptional 10.0% |
| Immigrants | Hong Kong | 100.0 /100 | #9 | Exceptional 10.0% |
| Immigrants | China | 100.0 /100 | #10 | Exceptional 10.1% |
| Iranians | 100.0 /100 | #11 | Exceptional 10.1% |
| Immigrants | Israel | 100.0 /100 | #12 | Exceptional 10.1% |
| Immigrants | Eastern Asia | 100.0 /100 | #13 | Exceptional 10.2% |
| Immigrants | Korea | 100.0 /100 | #14 | Exceptional 10.2% |
| Okinawans | 100.0 /100 | #15 | Exceptional 10.3% |
| Indians (Asian) | 100.0 /100 | #16 | Exceptional 10.3% |
| Immigrants | Iran | 100.0 /100 | #17 | Exceptional 10.3% |
| Burmese | 100.0 /100 | #18 | Exceptional 10.4% |
| Immigrants | Pakistan | 100.0 /100 | #19 | Exceptional 10.4% |
Demographics Similar to Armenians by Disability
In terms of disability, the demographic groups most similar to Armenians are Guatemalan (11.6%, a difference of 0.040%), Immigrants from Barbados (11.6%, a difference of 0.080%), Immigrants from Cuba (11.6%, a difference of 0.15%), Immigrants from Middle Africa (11.6%, a difference of 0.18%), and Immigrants from Fiji (11.6%, a difference of 0.19%).
| Demographics | Rating | Rank | Disability |
| Immigrants | Kenya | 72.1 /100 | #151 | Good 11.6% |
| Immigrants | Moldova | 72.0 /100 | #152 | Good 11.6% |
| Immigrants | Ghana | 71.2 /100 | #153 | Good 11.6% |
| Immigrants | Guatemala | 71.1 /100 | #154 | Good 11.6% |
| Immigrants | Netherlands | 69.8 /100 | #155 | Good 11.6% |
| Immigrants | Fiji | 69.5 /100 | #156 | Good 11.6% |
| Immigrants | Middle Africa | 69.5 /100 | #157 | Good 11.6% |
| Armenians | 65.9 /100 | #158 | Good 11.6% |
| Guatemalans | 65.1 /100 | #159 | Good 11.6% |
| Immigrants | Barbados | 64.2 /100 | #160 | Good 11.6% |
| Immigrants | Cuba | 62.8 /100 | #161 | Good 11.6% |
| Immigrants | Haiti | 59.2 /100 | #162 | Average 11.7% |
| Immigrants | Trinidad and Tobago | 58.9 /100 | #163 | Average 11.7% |
| Syrians | 58.5 /100 | #164 | Average 11.7% |
| Cubans | 56.7 /100 | #165 | Average 11.7% |