Indian (Asian) vs South American Disability Age 5 to 17
COMPARE
Indian (Asian)
South American
Disability Age 5 to 17
Disability Age 5 to 17 Comparison
Indians (Asian)
South Americans
4.6%
DISABILITY AGE 5 TO 17
100.0/ 100
METRIC RATING
8th/ 347
METRIC RANK
5.4%
DISABILITY AGE 5 TO 17
97.1/ 100
METRIC RATING
118th/ 347
METRIC RANK
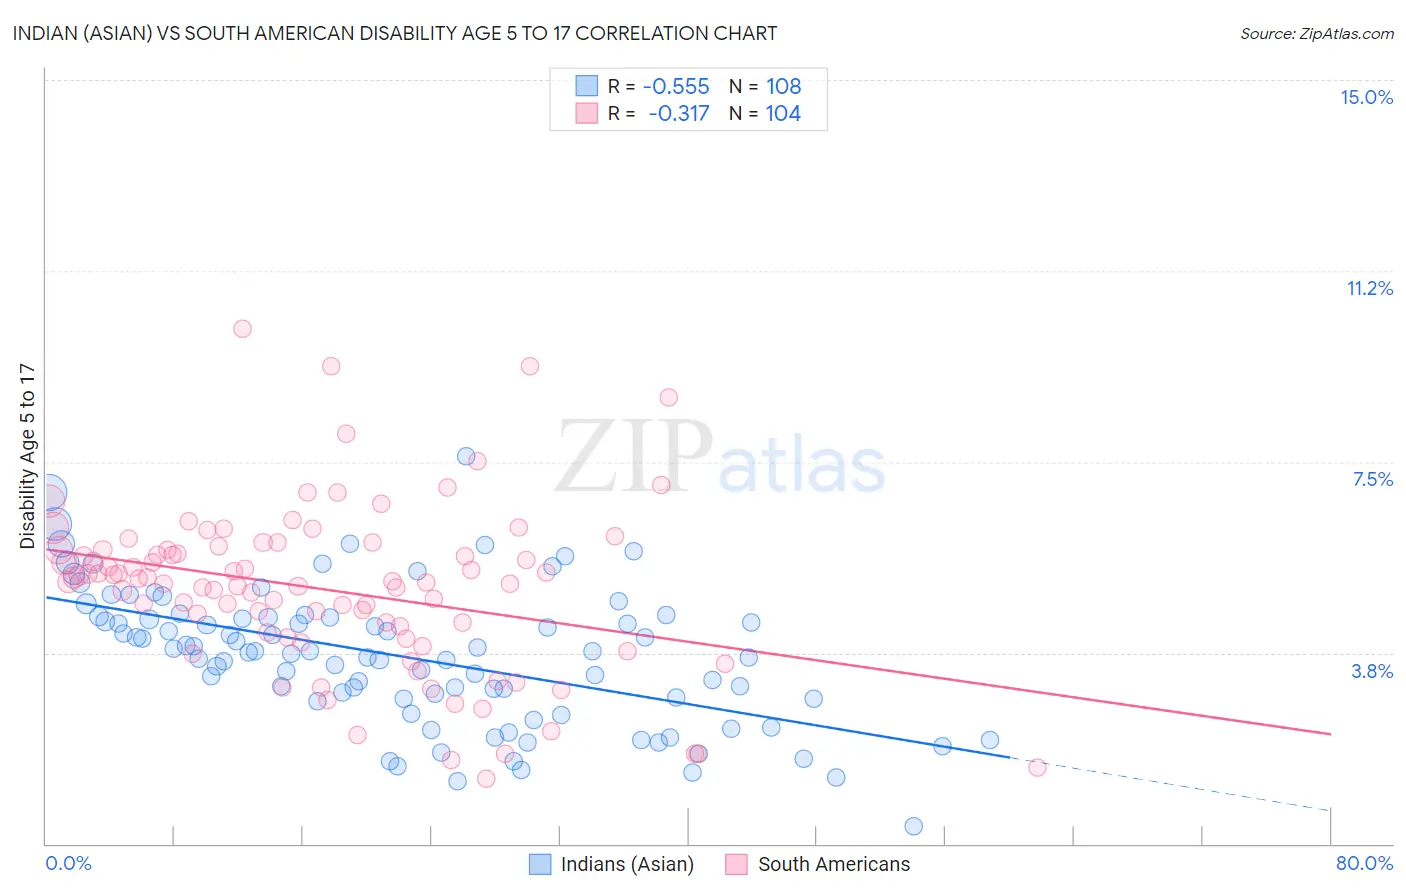
Indian (Asian) vs South American Disability Age 5 to 17 Correlation Chart
The statistical analysis conducted on geographies consisting of 488,980,607 people shows a substantial negative correlation between the proportion of Indians (Asian) and percentage of population with a disability between the ages 5 and 17 in the United States with a correlation coefficient (R) of -0.555 and weighted average of 4.6%. Similarly, the statistical analysis conducted on geographies consisting of 487,738,327 people shows a mild negative correlation between the proportion of South Americans and percentage of population with a disability between the ages 5 and 17 in the United States with a correlation coefficient (R) of -0.317 and weighted average of 5.4%, a difference of 17.3%.
Disability Age 5 to 17 Correlation Summary
| Measurement | Indian (Asian) | South American |
| Minimum | 0.35% | 1.3% |
| Maximum | 7.6% | 10.1% |
| Range | 7.3% | 8.8% |
| Mean | 3.7% | 5.0% |
| Median | 3.8% | 5.2% |
| Interquartile 25% (IQ1) | 2.8% | 4.1% |
| Interquartile 75% (IQ3) | 4.4% | 5.8% |
| Interquartile Range (IQR) | 1.6% | 1.7% |
| Standard Deviation (Sample) | 1.3% | 1.6% |
| Standard Deviation (Population) | 1.3% | 1.6% |
Similar Demographics by Disability Age 5 to 17
Demographics Similar to Indians (Asian) by Disability Age 5 to 17
In terms of disability age 5 to 17, the demographic groups most similar to Indians (Asian) are Immigrants from Eastern Asia (4.6%, a difference of 0.33%), Immigrants from India (4.6%, a difference of 0.40%), Armenian (4.6%, a difference of 0.56%), Iranian (4.6%, a difference of 0.80%), and Immigrants from China (4.5%, a difference of 0.93%).
| Demographics | Rating | Rank | Disability Age 5 to 17 |
| Immigrants | Armenia | 100.0 /100 | #1 | Exceptional 4.1% |
| Immigrants | Taiwan | 100.0 /100 | #2 | Exceptional 4.2% |
| Immigrants | Hong Kong | 100.0 /100 | #3 | Exceptional 4.3% |
| Filipinos | 100.0 /100 | #4 | Exceptional 4.3% |
| Immigrants | Iran | 100.0 /100 | #5 | Exceptional 4.4% |
| Immigrants | Israel | 100.0 /100 | #6 | Exceptional 4.5% |
| Immigrants | China | 100.0 /100 | #7 | Exceptional 4.5% |
| Indians (Asian) | 100.0 /100 | #8 | Exceptional 4.6% |
| Immigrants | Eastern Asia | 100.0 /100 | #9 | Exceptional 4.6% |
| Immigrants | India | 100.0 /100 | #10 | Exceptional 4.6% |
| Armenians | 100.0 /100 | #11 | Exceptional 4.6% |
| Iranians | 100.0 /100 | #12 | Exceptional 4.6% |
| Thais | 100.0 /100 | #13 | Exceptional 4.7% |
| Immigrants | Korea | 100.0 /100 | #14 | Exceptional 4.7% |
| Chinese | 100.0 /100 | #15 | Exceptional 4.7% |
Demographics Similar to South Americans by Disability Age 5 to 17
In terms of disability age 5 to 17, the demographic groups most similar to South Americans are Immigrants from South America (5.4%, a difference of 0.010%), Immigrants (5.4%, a difference of 0.060%), Immigrants from Afghanistan (5.3%, a difference of 0.11%), Cypriot (5.3%, a difference of 0.27%), and Cuban (5.3%, a difference of 0.33%).
| Demographics | Rating | Rank | Disability Age 5 to 17 |
| Ethiopians | 97.9 /100 | #111 | Exceptional 5.3% |
| Immigrants | Latvia | 97.9 /100 | #112 | Exceptional 5.3% |
| Aleuts | 97.8 /100 | #113 | Exceptional 5.3% |
| Immigrants | Northern Europe | 97.8 /100 | #114 | Exceptional 5.3% |
| Cubans | 97.8 /100 | #115 | Exceptional 5.3% |
| Cypriots | 97.7 /100 | #116 | Exceptional 5.3% |
| Immigrants | Afghanistan | 97.4 /100 | #117 | Exceptional 5.3% |
| South Americans | 97.1 /100 | #118 | Exceptional 5.4% |
| Immigrants | South America | 97.1 /100 | #119 | Exceptional 5.4% |
| Immigrants | Immigrants | 97.0 /100 | #120 | Exceptional 5.4% |
| Maltese | 96.0 /100 | #121 | Exceptional 5.4% |
| Chileans | 95.8 /100 | #122 | Exceptional 5.4% |
| Immigrants | Ethiopia | 95.5 /100 | #123 | Exceptional 5.4% |
| Crow | 95.0 /100 | #124 | Exceptional 5.4% |
| Immigrants | Chile | 95.0 /100 | #125 | Exceptional 5.4% |