Immigrants from Yemen vs Portuguese Female Disability
COMPARE
Immigrants from Yemen
Portuguese
Female Disability
Female Disability Comparison
Immigrants from Yemen
Portuguese
13.2%
FEMALE DISABILITY
0.0/ 100
METRIC RATING
290th/ 347
METRIC RANK
13.0%
FEMALE DISABILITY
0.1/ 100
METRIC RATING
274th/ 347
METRIC RANK
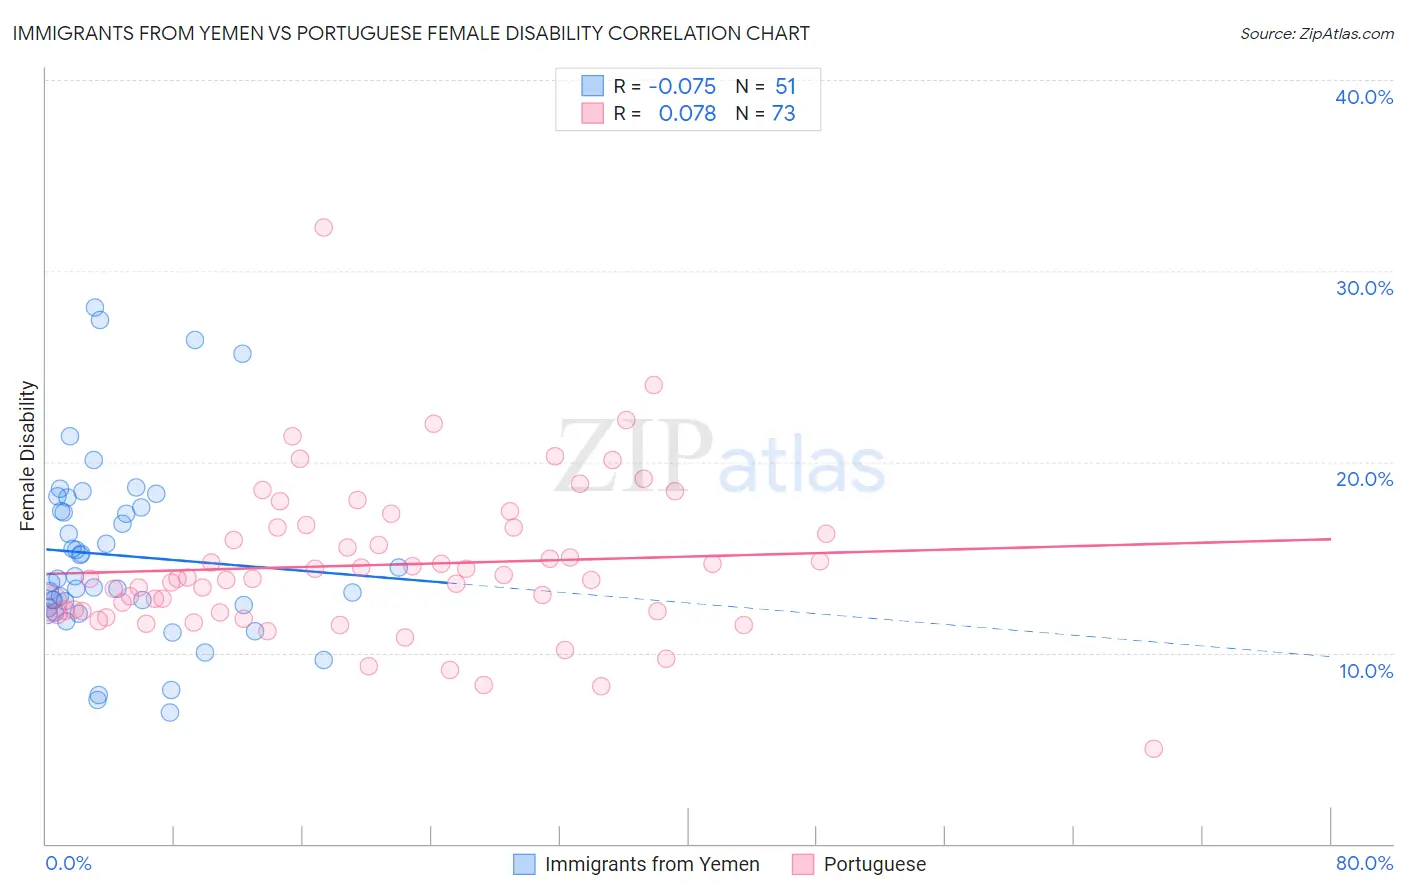
Immigrants from Yemen vs Portuguese Female Disability Correlation Chart
The statistical analysis conducted on geographies consisting of 82,433,611 people shows a slight negative correlation between the proportion of Immigrants from Yemen and percentage of females with a disability in the United States with a correlation coefficient (R) of -0.075 and weighted average of 13.2%. Similarly, the statistical analysis conducted on geographies consisting of 450,255,075 people shows a slight positive correlation between the proportion of Portuguese and percentage of females with a disability in the United States with a correlation coefficient (R) of 0.078 and weighted average of 13.0%, a difference of 1.9%.
Female Disability Correlation Summary
| Measurement | Immigrants from Yemen | Portuguese |
| Minimum | 6.9% | 5.0% |
| Maximum | 28.1% | 32.3% |
| Range | 21.2% | 27.3% |
| Mean | 15.1% | 14.6% |
| Median | 13.9% | 13.9% |
| Interquartile 25% (IQ1) | 12.4% | 12.1% |
| Interquartile 75% (IQ3) | 17.6% | 16.6% |
| Interquartile Range (IQR) | 5.2% | 4.5% |
| Standard Deviation (Sample) | 4.8% | 4.1% |
| Standard Deviation (Population) | 4.7% | 4.1% |
Demographics Similar to Immigrants from Yemen and Portuguese by Female Disability
In terms of female disability, the demographic groups most similar to Immigrants from Yemen are Tlingit-Haida (13.2%, a difference of 0.0%), Shoshone (13.2%, a difference of 0.060%), White/Caucasian (13.2%, a difference of 0.18%), Yakama (13.2%, a difference of 0.23%), and Yaqui (13.2%, a difference of 0.27%). Similarly, the demographic groups most similar to Portuguese are Cheyenne (13.0%, a difference of 0.050%), Immigrants from Dominica (13.0%, a difference of 0.10%), Sioux (12.9%, a difference of 0.12%), German (12.9%, a difference of 0.14%), and Spanish (13.0%, a difference of 0.31%).
| Demographics | Rating | Rank | Female Disability |
| Germans | 0.1 /100 | #272 | Tragic 12.9% |
| Sioux | 0.1 /100 | #273 | Tragic 12.9% |
| Portuguese | 0.1 /100 | #274 | Tragic 13.0% |
| Cheyenne | 0.1 /100 | #275 | Tragic 13.0% |
| Immigrants | Dominica | 0.1 /100 | #276 | Tragic 13.0% |
| Spanish | 0.1 /100 | #277 | Tragic 13.0% |
| Scottish | 0.1 /100 | #278 | Tragic 13.0% |
| Arapaho | 0.1 /100 | #279 | Tragic 13.0% |
| Irish | 0.1 /100 | #280 | Tragic 13.1% |
| U.S. Virgin Islanders | 0.1 /100 | #281 | Tragic 13.1% |
| Welsh | 0.0 /100 | #282 | Tragic 13.1% |
| English | 0.0 /100 | #283 | Tragic 13.1% |
| Hmong | 0.0 /100 | #284 | Tragic 13.1% |
| Bangladeshis | 0.0 /100 | #285 | Tragic 13.1% |
| Fijians | 0.0 /100 | #286 | Tragic 13.1% |
| Yaqui | 0.0 /100 | #287 | Tragic 13.2% |
| Whites/Caucasians | 0.0 /100 | #288 | Tragic 13.2% |
| Tlingit-Haida | 0.0 /100 | #289 | Tragic 13.2% |
| Immigrants | Yemen | 0.0 /100 | #290 | Tragic 13.2% |
| Shoshone | 0.0 /100 | #291 | Tragic 13.2% |
| Yakama | 0.0 /100 | #292 | Tragic 13.2% |