Immigrants from Ukraine vs Immigrants from Zimbabwe Self-Care Disability
COMPARE
Immigrants from Ukraine
Immigrants from Zimbabwe
Self-Care Disability
Self-Care Disability Comparison
Immigrants from Ukraine
Immigrants from Zimbabwe
2.7%
SELF-CARE DISABILITY
0.1/ 100
METRIC RATING
277th/ 347
METRIC RANK
2.3%
SELF-CARE DISABILITY
99.9/ 100
METRIC RATING
29th/ 347
METRIC RANK
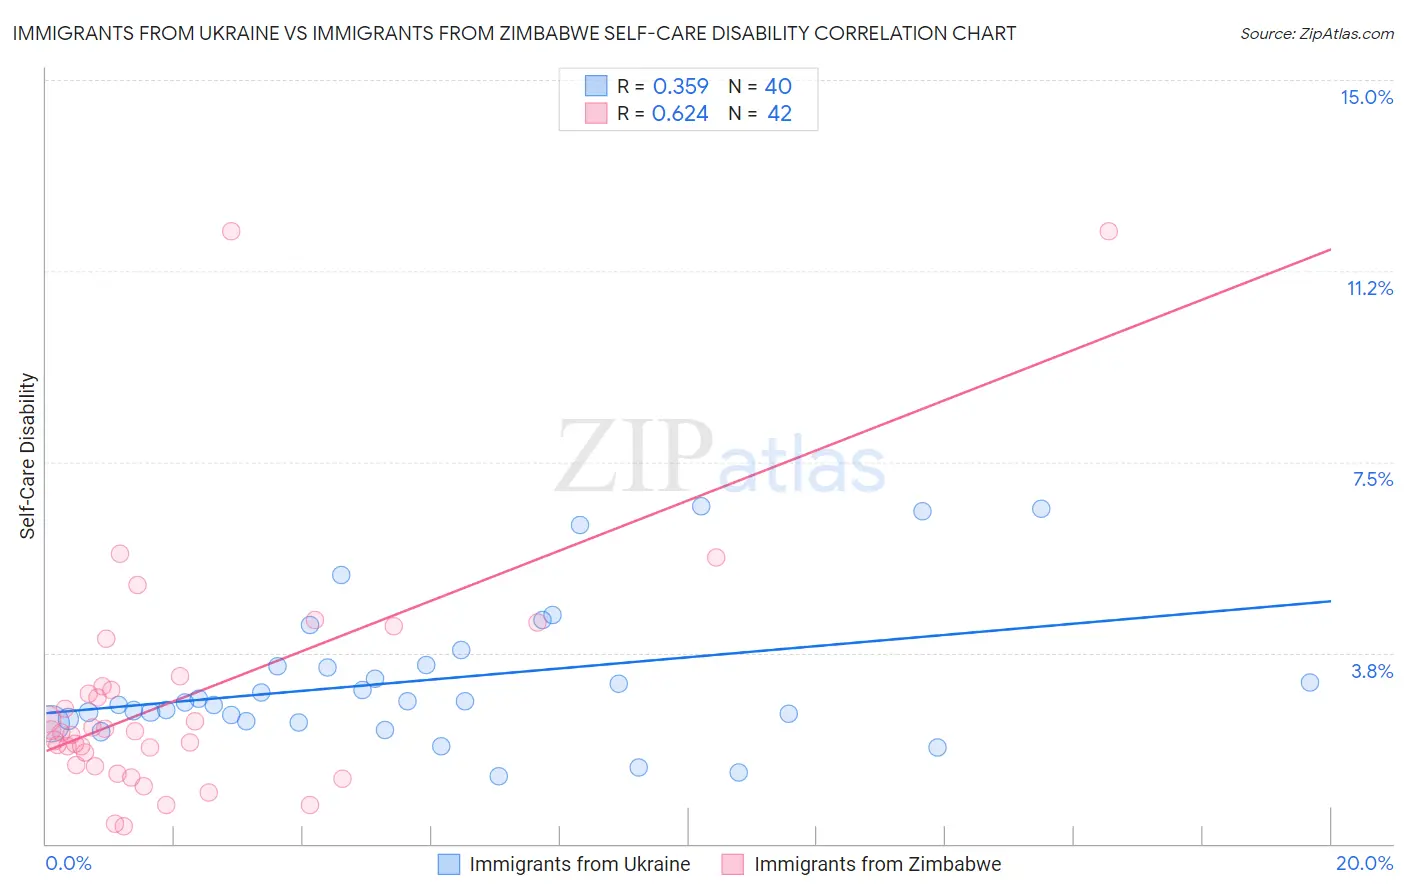
Immigrants from Ukraine vs Immigrants from Zimbabwe Self-Care Disability Correlation Chart
The statistical analysis conducted on geographies consisting of 289,474,241 people shows a mild positive correlation between the proportion of Immigrants from Ukraine and percentage of population with self-care disability in the United States with a correlation coefficient (R) of 0.359 and weighted average of 2.7%. Similarly, the statistical analysis conducted on geographies consisting of 117,788,572 people shows a significant positive correlation between the proportion of Immigrants from Zimbabwe and percentage of population with self-care disability in the United States with a correlation coefficient (R) of 0.624 and weighted average of 2.3%, a difference of 19.3%.
Self-Care Disability Correlation Summary
| Measurement | Immigrants from Ukraine | Immigrants from Zimbabwe |
| Minimum | 1.3% | 0.34% |
| Maximum | 6.6% | 12.0% |
| Range | 5.3% | 11.7% |
| Mean | 3.2% | 2.9% |
| Median | 2.8% | 2.2% |
| Interquartile 25% (IQ1) | 2.4% | 1.6% |
| Interquartile 75% (IQ3) | 3.5% | 3.1% |
| Interquartile Range (IQR) | 1.1% | 1.5% |
| Standard Deviation (Sample) | 1.4% | 2.4% |
| Standard Deviation (Population) | 1.4% | 2.4% |
Similar Demographics by Self-Care Disability
Demographics Similar to Immigrants from Ukraine by Self-Care Disability
In terms of self-care disability, the demographic groups most similar to Immigrants from Ukraine are Japanese (2.7%, a difference of 0.060%), Ottawa (2.7%, a difference of 0.080%), Iroquois (2.7%, a difference of 0.18%), Yakama (2.7%, a difference of 0.19%), and Immigrants from Trinidad and Tobago (2.7%, a difference of 0.19%).
| Demographics | Rating | Rank | Self-Care Disability |
| Immigrants | Micronesia | 0.1 /100 | #270 | Tragic 2.7% |
| Trinidadians and Tobagonians | 0.1 /100 | #271 | Tragic 2.7% |
| Immigrants | Laos | 0.1 /100 | #272 | Tragic 2.7% |
| Mexicans | 0.1 /100 | #273 | Tragic 2.7% |
| Yakama | 0.1 /100 | #274 | Tragic 2.7% |
| Immigrants | Trinidad and Tobago | 0.1 /100 | #275 | Tragic 2.7% |
| Japanese | 0.1 /100 | #276 | Tragic 2.7% |
| Immigrants | Ukraine | 0.1 /100 | #277 | Tragic 2.7% |
| Ottawa | 0.1 /100 | #278 | Tragic 2.7% |
| Iroquois | 0.1 /100 | #279 | Tragic 2.7% |
| Hispanics or Latinos | 0.1 /100 | #280 | Tragic 2.7% |
| Immigrants | Iraq | 0.0 /100 | #281 | Tragic 2.7% |
| Apache | 0.0 /100 | #282 | Tragic 2.7% |
| Delaware | 0.0 /100 | #283 | Tragic 2.7% |
| Fijians | 0.0 /100 | #284 | Tragic 2.7% |
Demographics Similar to Immigrants from Zimbabwe by Self-Care Disability
In terms of self-care disability, the demographic groups most similar to Immigrants from Zimbabwe are Inupiat (2.2%, a difference of 0.090%), Venezuelan (2.2%, a difference of 0.25%), Immigrants from Sri Lanka (2.2%, a difference of 0.26%), Turkish (2.2%, a difference of 0.33%), and Paraguayan (2.3%, a difference of 0.33%).
| Demographics | Rating | Rank | Self-Care Disability |
| Immigrants | Venezuela | 100.0 /100 | #22 | Exceptional 2.2% |
| Cambodians | 100.0 /100 | #23 | Exceptional 2.2% |
| Cypriots | 100.0 /100 | #24 | Exceptional 2.2% |
| Turks | 100.0 /100 | #25 | Exceptional 2.2% |
| Immigrants | Sri Lanka | 99.9 /100 | #26 | Exceptional 2.2% |
| Venezuelans | 99.9 /100 | #27 | Exceptional 2.2% |
| Inupiat | 99.9 /100 | #28 | Exceptional 2.2% |
| Immigrants | Zimbabwe | 99.9 /100 | #29 | Exceptional 2.3% |
| Paraguayans | 99.9 /100 | #30 | Exceptional 2.3% |
| Danes | 99.9 /100 | #31 | Exceptional 2.3% |
| Burmese | 99.9 /100 | #32 | Exceptional 2.3% |
| Immigrants | Korea | 99.9 /100 | #33 | Exceptional 2.3% |
| Immigrants | Turkey | 99.9 /100 | #34 | Exceptional 2.3% |
| Immigrants | Australia | 99.9 /100 | #35 | Exceptional 2.3% |
| Immigrants | Lithuania | 99.9 /100 | #36 | Exceptional 2.3% |