Immigrants from Switzerland vs Immigrants from Uganda Disability
COMPARE
Immigrants from Switzerland
Immigrants from Uganda
Disability
Disability Comparison
Immigrants from Switzerland
Immigrants from Uganda
11.1%
DISABILITY
99.0/ 100
METRIC RATING
83rd/ 347
METRIC RANK
11.3%
DISABILITY
95.7/ 100
METRIC RATING
109th/ 347
METRIC RANK
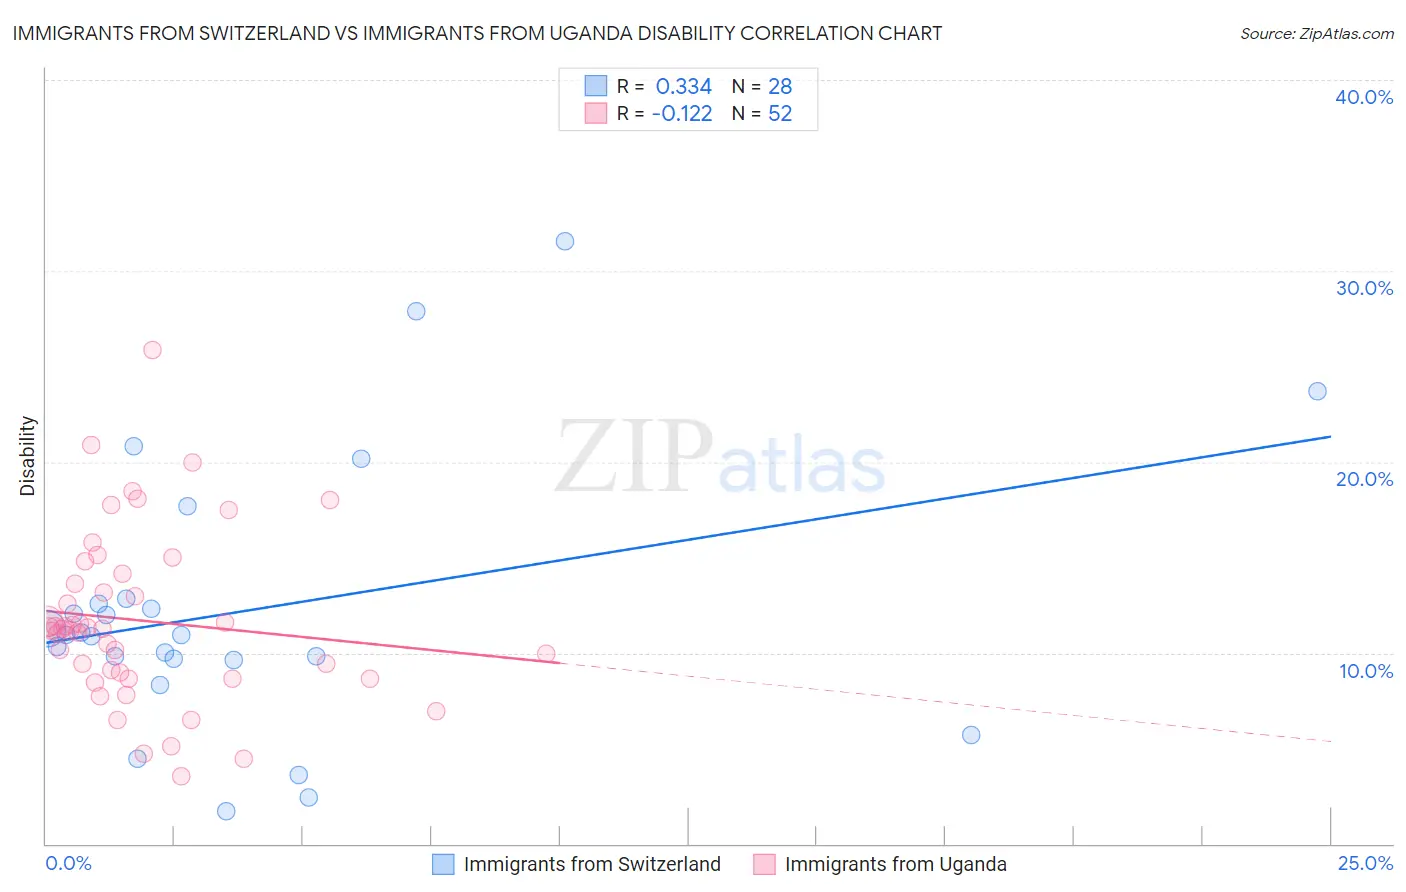
Immigrants from Switzerland vs Immigrants from Uganda Disability Correlation Chart
The statistical analysis conducted on geographies consisting of 148,083,084 people shows a mild positive correlation between the proportion of Immigrants from Switzerland and percentage of population with a disability in the United States with a correlation coefficient (R) of 0.334 and weighted average of 11.1%. Similarly, the statistical analysis conducted on geographies consisting of 125,981,344 people shows a poor negative correlation between the proportion of Immigrants from Uganda and percentage of population with a disability in the United States with a correlation coefficient (R) of -0.122 and weighted average of 11.3%, a difference of 1.8%.
Disability Correlation Summary
| Measurement | Immigrants from Switzerland | Immigrants from Uganda |
| Minimum | 1.7% | 3.5% |
| Maximum | 31.6% | 25.9% |
| Range | 29.9% | 22.4% |
| Mean | 12.3% | 11.7% |
| Median | 10.9% | 11.3% |
| Interquartile 25% (IQ1) | 9.7% | 8.8% |
| Interquartile 75% (IQ3) | 12.7% | 13.9% |
| Interquartile Range (IQR) | 3.0% | 5.1% |
| Standard Deviation (Sample) | 7.1% | 4.4% |
| Standard Deviation (Population) | 7.0% | 4.4% |
Similar Demographics by Disability
Demographics Similar to Immigrants from Switzerland by Disability
In terms of disability, the demographic groups most similar to Immigrants from Switzerland are Immigrants from Sierra Leone (11.1%, a difference of 0.010%), Chilean (11.1%, a difference of 0.030%), Immigrants from Poland (11.1%, a difference of 0.080%), Immigrants from Belarus (11.1%, a difference of 0.16%), and Immigrants from Russia (11.1%, a difference of 0.17%).
| Demographics | Rating | Rank | Disability |
| Sierra Leoneans | 99.3 /100 | #76 | Exceptional 11.0% |
| Immigrants | Belgium | 99.3 /100 | #77 | Exceptional 11.0% |
| Immigrants | Cameroon | 99.3 /100 | #78 | Exceptional 11.1% |
| Immigrants | Jordan | 99.3 /100 | #79 | Exceptional 11.1% |
| Immigrants | Ireland | 99.3 /100 | #80 | Exceptional 11.1% |
| Immigrants | Poland | 99.1 /100 | #81 | Exceptional 11.1% |
| Chileans | 99.1 /100 | #82 | Exceptional 11.1% |
| Immigrants | Switzerland | 99.0 /100 | #83 | Exceptional 11.1% |
| Immigrants | Sierra Leone | 99.0 /100 | #84 | Exceptional 11.1% |
| Immigrants | Belarus | 98.9 /100 | #85 | Exceptional 11.1% |
| Immigrants | Russia | 98.9 /100 | #86 | Exceptional 11.1% |
| Palestinians | 98.9 /100 | #87 | Exceptional 11.1% |
| Immigrants | Romania | 98.5 /100 | #88 | Exceptional 11.2% |
| Immigrants | South Africa | 98.2 /100 | #89 | Exceptional 11.2% |
| Immigrants | Brazil | 98.1 /100 | #90 | Exceptional 11.2% |
Demographics Similar to Immigrants from Uganda by Disability
In terms of disability, the demographic groups most similar to Immigrants from Uganda are Immigrants from Denmark (11.3%, a difference of 0.020%), Immigrants from Nigeria (11.3%, a difference of 0.080%), Immigrants from South Eastern Asia (11.3%, a difference of 0.080%), Nicaraguan (11.3%, a difference of 0.16%), and Immigrants from Eastern Europe (11.3%, a difference of 0.18%).
| Demographics | Rating | Rank | Disability |
| Immigrants | Eastern Africa | 96.7 /100 | #102 | Exceptional 11.3% |
| Immigrants | Uruguay | 96.4 /100 | #103 | Exceptional 11.3% |
| Immigrants | Immigrants | 96.4 /100 | #104 | Exceptional 11.3% |
| Immigrants | Kazakhstan | 96.4 /100 | #105 | Exceptional 11.3% |
| Immigrants | Eastern Europe | 96.3 /100 | #106 | Exceptional 11.3% |
| Nicaraguans | 96.2 /100 | #107 | Exceptional 11.3% |
| Immigrants | Nigeria | 96.0 /100 | #108 | Exceptional 11.3% |
| Immigrants | Uganda | 95.7 /100 | #109 | Exceptional 11.3% |
| Immigrants | Denmark | 95.6 /100 | #110 | Exceptional 11.3% |
| Immigrants | South Eastern Asia | 95.4 /100 | #111 | Exceptional 11.3% |
| Immigrants | Uzbekistan | 94.9 /100 | #112 | Exceptional 11.3% |
| Guyanese | 94.7 /100 | #113 | Exceptional 11.3% |
| Immigrants | Syria | 94.7 /100 | #114 | Exceptional 11.3% |
| Immigrants | Philippines | 94.6 /100 | #115 | Exceptional 11.3% |
| Immigrants | Northern Europe | 94.1 /100 | #116 | Exceptional 11.3% |