Immigrants from Switzerland vs Immigrants from Laos Disability
COMPARE
Immigrants from Switzerland
Immigrants from Laos
Disability
Disability Comparison
Immigrants from Switzerland
Immigrants from Laos
11.1%
DISABILITY
99.0/ 100
METRIC RATING
83rd/ 347
METRIC RANK
12.4%
DISABILITY
0.5/ 100
METRIC RATING
257th/ 347
METRIC RANK
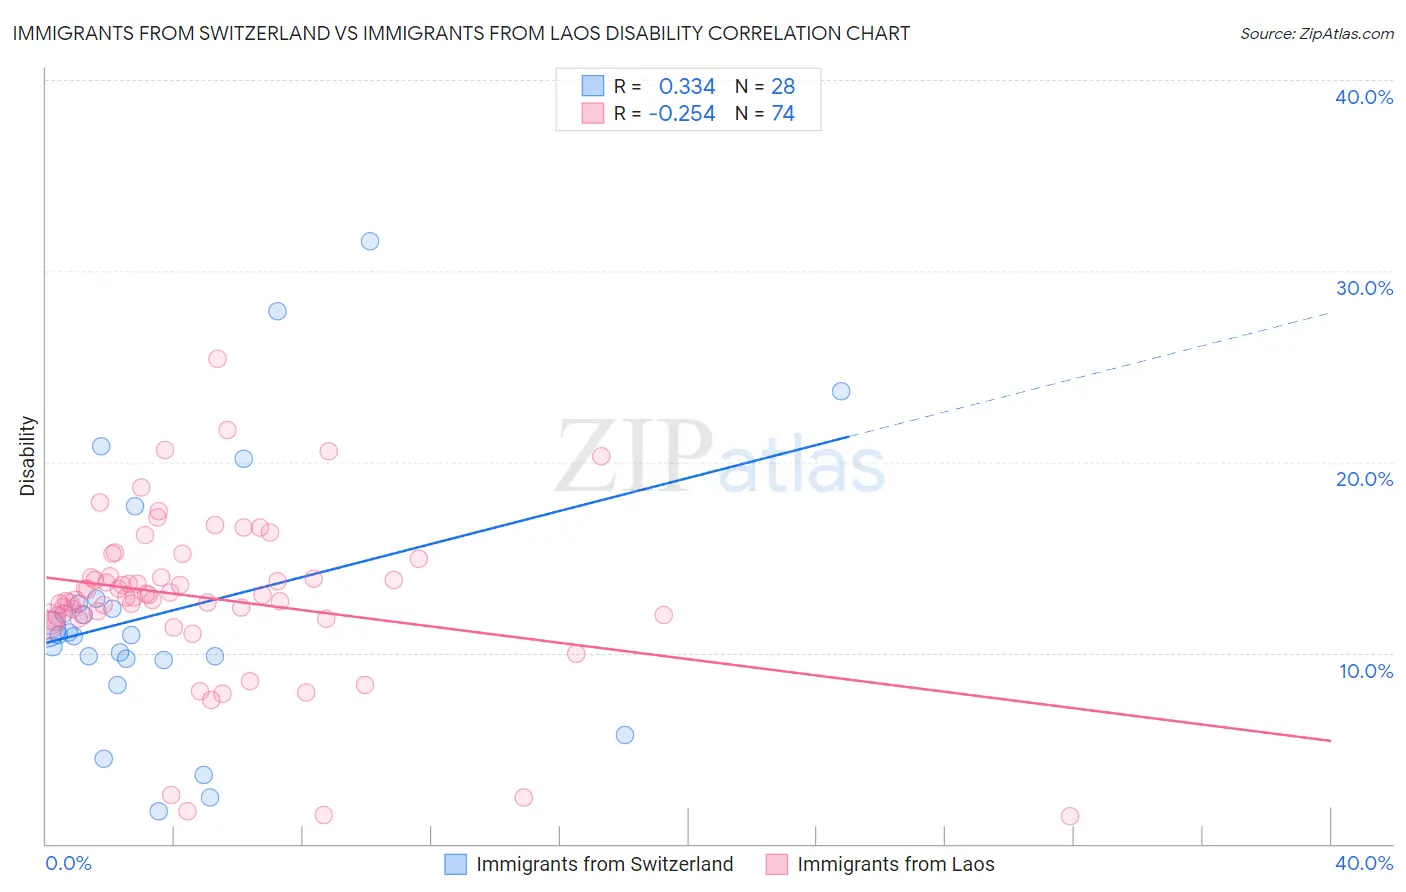
Immigrants from Switzerland vs Immigrants from Laos Disability Correlation Chart
The statistical analysis conducted on geographies consisting of 148,083,084 people shows a mild positive correlation between the proportion of Immigrants from Switzerland and percentage of population with a disability in the United States with a correlation coefficient (R) of 0.334 and weighted average of 11.1%. Similarly, the statistical analysis conducted on geographies consisting of 201,466,628 people shows a weak negative correlation between the proportion of Immigrants from Laos and percentage of population with a disability in the United States with a correlation coefficient (R) of -0.254 and weighted average of 12.4%, a difference of 11.5%.
Disability Correlation Summary
| Measurement | Immigrants from Switzerland | Immigrants from Laos |
| Minimum | 1.7% | 1.4% |
| Maximum | 31.6% | 25.4% |
| Range | 29.9% | 24.0% |
| Mean | 12.3% | 12.9% |
| Median | 10.9% | 13.0% |
| Interquartile 25% (IQ1) | 9.7% | 11.8% |
| Interquartile 75% (IQ3) | 12.7% | 14.0% |
| Interquartile Range (IQR) | 3.0% | 2.2% |
| Standard Deviation (Sample) | 7.1% | 4.3% |
| Standard Deviation (Population) | 7.0% | 4.3% |
Similar Demographics by Disability
Demographics Similar to Immigrants from Switzerland by Disability
In terms of disability, the demographic groups most similar to Immigrants from Switzerland are Immigrants from Sierra Leone (11.1%, a difference of 0.010%), Chilean (11.1%, a difference of 0.030%), Immigrants from Poland (11.1%, a difference of 0.080%), Immigrants from Belarus (11.1%, a difference of 0.16%), and Immigrants from Russia (11.1%, a difference of 0.17%).
| Demographics | Rating | Rank | Disability |
| Sierra Leoneans | 99.3 /100 | #76 | Exceptional 11.0% |
| Immigrants | Belgium | 99.3 /100 | #77 | Exceptional 11.0% |
| Immigrants | Cameroon | 99.3 /100 | #78 | Exceptional 11.1% |
| Immigrants | Jordan | 99.3 /100 | #79 | Exceptional 11.1% |
| Immigrants | Ireland | 99.3 /100 | #80 | Exceptional 11.1% |
| Immigrants | Poland | 99.1 /100 | #81 | Exceptional 11.1% |
| Chileans | 99.1 /100 | #82 | Exceptional 11.1% |
| Immigrants | Switzerland | 99.0 /100 | #83 | Exceptional 11.1% |
| Immigrants | Sierra Leone | 99.0 /100 | #84 | Exceptional 11.1% |
| Immigrants | Belarus | 98.9 /100 | #85 | Exceptional 11.1% |
| Immigrants | Russia | 98.9 /100 | #86 | Exceptional 11.1% |
| Palestinians | 98.9 /100 | #87 | Exceptional 11.1% |
| Immigrants | Romania | 98.5 /100 | #88 | Exceptional 11.2% |
| Immigrants | South Africa | 98.2 /100 | #89 | Exceptional 11.2% |
| Immigrants | Brazil | 98.1 /100 | #90 | Exceptional 11.2% |
Demographics Similar to Immigrants from Laos by Disability
In terms of disability, the demographic groups most similar to Immigrants from Laos are Immigrants from Dominica (12.4%, a difference of 0.090%), Slavic (12.4%, a difference of 0.14%), Slovene (12.4%, a difference of 0.16%), Canadian (12.4%, a difference of 0.20%), and Immigrants from Liberia (12.4%, a difference of 0.23%).
| Demographics | Rating | Rank | Disability |
| Sub-Saharan Africans | 1.4 /100 | #250 | Tragic 12.3% |
| Europeans | 1.4 /100 | #251 | Tragic 12.3% |
| Bermudans | 1.1 /100 | #252 | Tragic 12.3% |
| Belgians | 0.8 /100 | #253 | Tragic 12.3% |
| German Russians | 0.8 /100 | #254 | Tragic 12.3% |
| Slovenes | 0.6 /100 | #255 | Tragic 12.4% |
| Immigrants | Dominica | 0.6 /100 | #256 | Tragic 12.4% |
| Immigrants | Laos | 0.5 /100 | #257 | Tragic 12.4% |
| Slavs | 0.5 /100 | #258 | Tragic 12.4% |
| Canadians | 0.4 /100 | #259 | Tragic 12.4% |
| Immigrants | Liberia | 0.4 /100 | #260 | Tragic 12.4% |
| Scandinavians | 0.4 /100 | #261 | Tragic 12.4% |
| Native Hawaiians | 0.3 /100 | #262 | Tragic 12.5% |
| Hawaiians | 0.2 /100 | #263 | Tragic 12.5% |
| Immigrants | Germany | 0.2 /100 | #264 | Tragic 12.5% |