Scandinavian vs Immigrants from Laos Disability
COMPARE
Scandinavian
Immigrants from Laos
Disability
Disability Comparison
Scandinavians
Immigrants from Laos
12.4%
DISABILITY
0.4/ 100
METRIC RATING
261st/ 347
METRIC RANK
12.4%
DISABILITY
0.5/ 100
METRIC RATING
257th/ 347
METRIC RANK
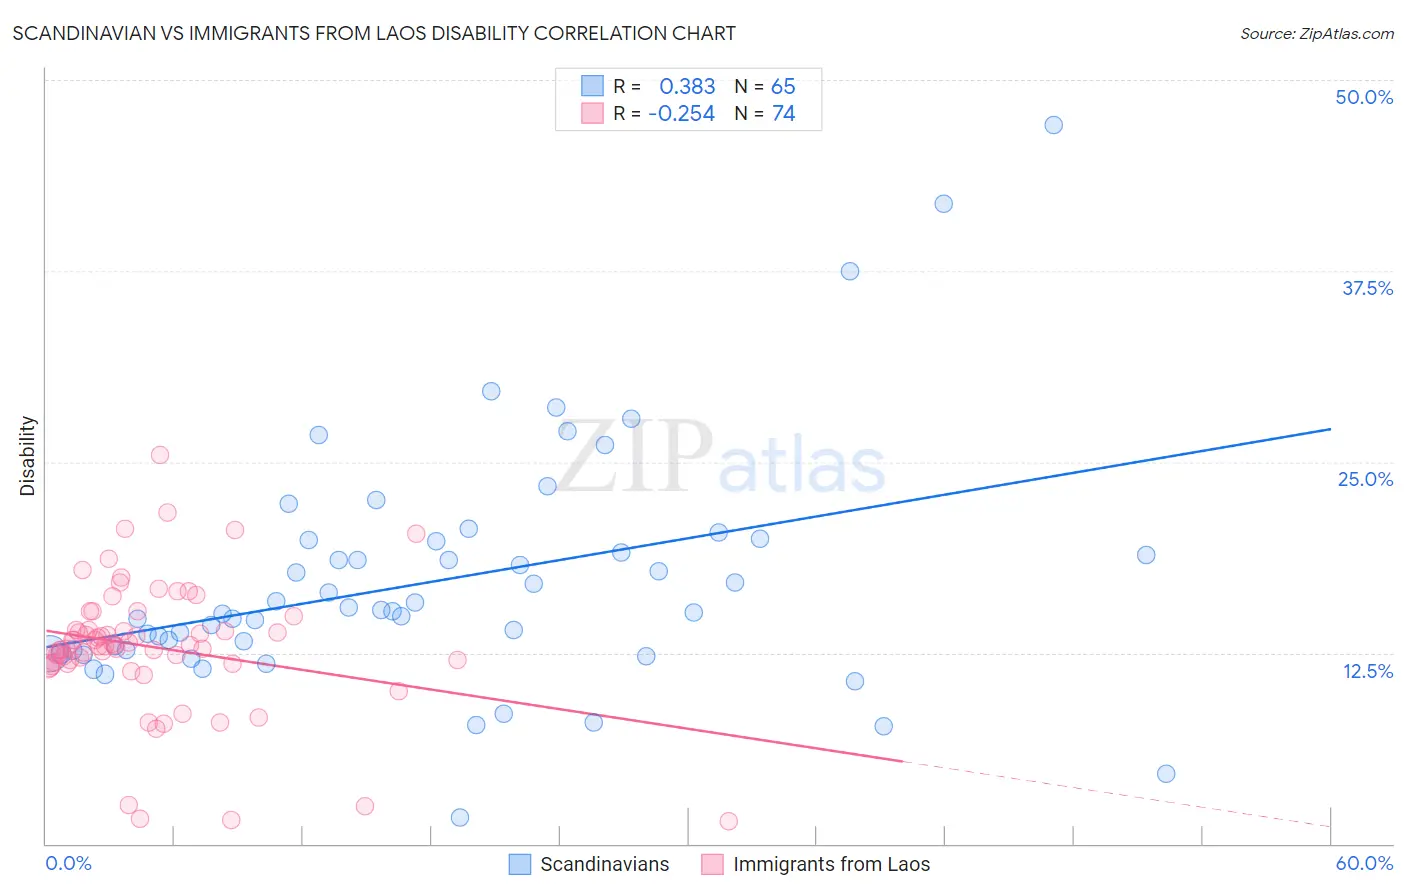
Scandinavian vs Immigrants from Laos Disability Correlation Chart
The statistical analysis conducted on geographies consisting of 472,547,672 people shows a mild positive correlation between the proportion of Scandinavians and percentage of population with a disability in the United States with a correlation coefficient (R) of 0.383 and weighted average of 12.4%. Similarly, the statistical analysis conducted on geographies consisting of 201,466,628 people shows a weak negative correlation between the proportion of Immigrants from Laos and percentage of population with a disability in the United States with a correlation coefficient (R) of -0.254 and weighted average of 12.4%, a difference of 0.30%.
Disability Correlation Summary
| Measurement | Scandinavian | Immigrants from Laos |
| Minimum | 1.7% | 1.4% |
| Maximum | 47.1% | 25.4% |
| Range | 45.4% | 24.0% |
| Mean | 17.2% | 12.9% |
| Median | 15.2% | 13.0% |
| Interquartile 25% (IQ1) | 12.6% | 11.8% |
| Interquartile 75% (IQ3) | 19.9% | 14.0% |
| Interquartile Range (IQR) | 7.3% | 2.2% |
| Standard Deviation (Sample) | 7.9% | 4.3% |
| Standard Deviation (Population) | 7.8% | 4.3% |
Demographics Similar to Scandinavians and Immigrants from Laos by Disability
In terms of disability, the demographic groups most similar to Scandinavians are Immigrants from Liberia (12.4%, a difference of 0.070%), Canadian (12.4%, a difference of 0.10%), Slavic (12.4%, a difference of 0.16%), Native Hawaiian (12.5%, a difference of 0.27%), and Immigrants from Dominica (12.4%, a difference of 0.39%). Similarly, the demographic groups most similar to Immigrants from Laos are Immigrants from Dominica (12.4%, a difference of 0.090%), Slavic (12.4%, a difference of 0.14%), Slovene (12.4%, a difference of 0.16%), Canadian (12.4%, a difference of 0.20%), and Immigrants from Liberia (12.4%, a difference of 0.23%).
| Demographics | Rating | Rank | Disability |
| Carpatho Rusyns | 1.4 /100 | #249 | Tragic 12.3% |
| Sub-Saharan Africans | 1.4 /100 | #250 | Tragic 12.3% |
| Europeans | 1.4 /100 | #251 | Tragic 12.3% |
| Bermudans | 1.1 /100 | #252 | Tragic 12.3% |
| Belgians | 0.8 /100 | #253 | Tragic 12.3% |
| German Russians | 0.8 /100 | #254 | Tragic 12.3% |
| Slovenes | 0.6 /100 | #255 | Tragic 12.4% |
| Immigrants | Dominica | 0.6 /100 | #256 | Tragic 12.4% |
| Immigrants | Laos | 0.5 /100 | #257 | Tragic 12.4% |
| Slavs | 0.5 /100 | #258 | Tragic 12.4% |
| Canadians | 0.4 /100 | #259 | Tragic 12.4% |
| Immigrants | Liberia | 0.4 /100 | #260 | Tragic 12.4% |
| Scandinavians | 0.4 /100 | #261 | Tragic 12.4% |
| Native Hawaiians | 0.3 /100 | #262 | Tragic 12.5% |
| Hawaiians | 0.2 /100 | #263 | Tragic 12.5% |
| Immigrants | Germany | 0.2 /100 | #264 | Tragic 12.5% |
| U.S. Virgin Islanders | 0.2 /100 | #265 | Tragic 12.5% |
| Czechoslovakians | 0.2 /100 | #266 | Tragic 12.5% |
| Spaniards | 0.2 /100 | #267 | Tragic 12.5% |
| Bangladeshis | 0.1 /100 | #268 | Tragic 12.6% |
| Immigrants | Dominican Republic | 0.1 /100 | #269 | Tragic 12.6% |