Immigrants from Spain vs Immigrants from Czechoslovakia Disability
COMPARE
Immigrants from Spain
Immigrants from Czechoslovakia
Disability
Disability Comparison
Immigrants from Spain
Immigrants from Czechoslovakia
10.9%
DISABILITY
99.8/ 100
METRIC RATING
53rd/ 347
METRIC RANK
11.2%
DISABILITY
97.4/ 100
METRIC RATING
99th/ 347
METRIC RANK
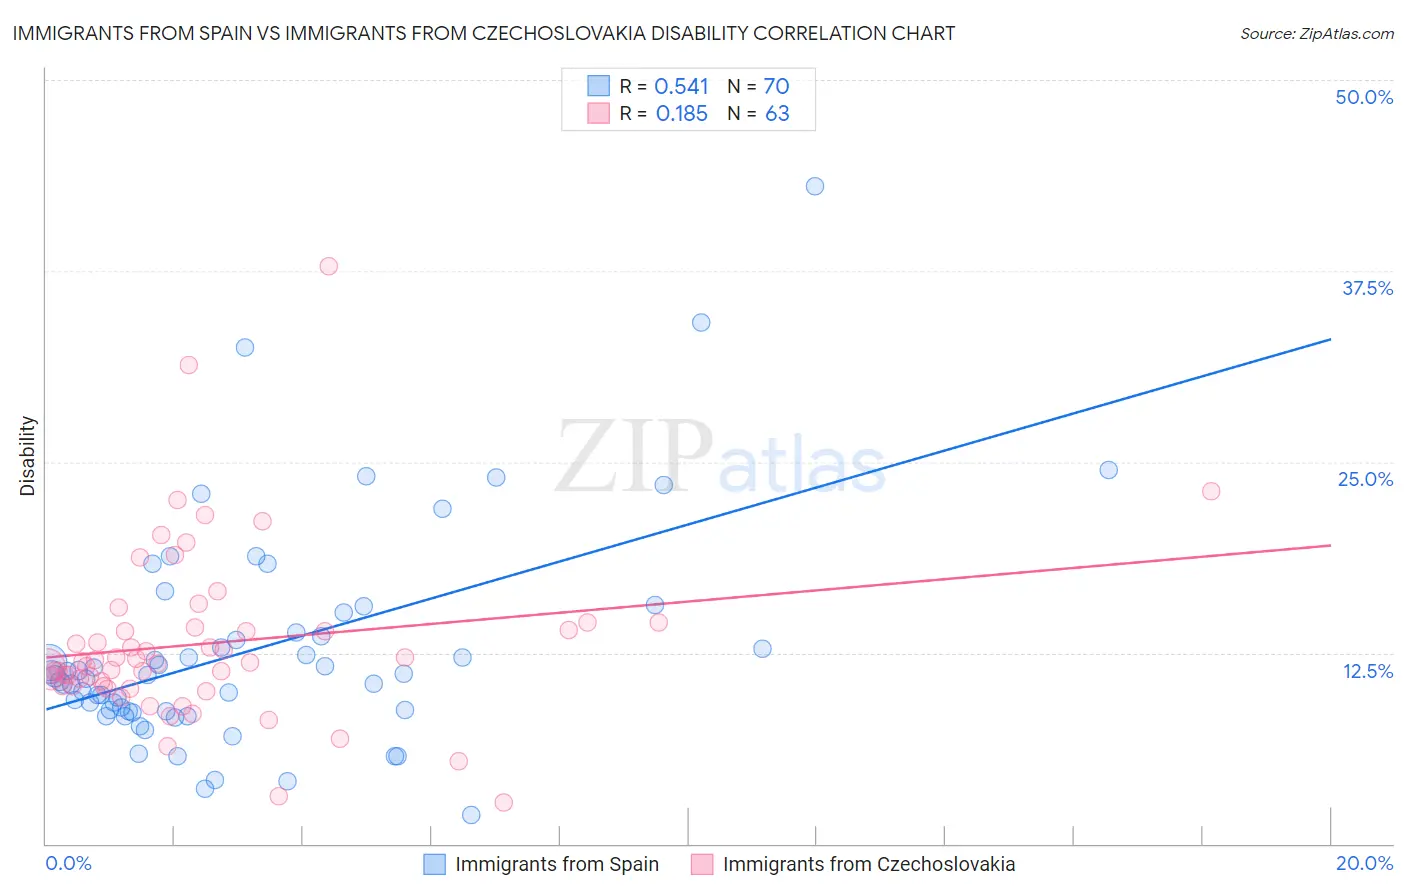
Immigrants from Spain vs Immigrants from Czechoslovakia Disability Correlation Chart
The statistical analysis conducted on geographies consisting of 239,685,180 people shows a substantial positive correlation between the proportion of Immigrants from Spain and percentage of population with a disability in the United States with a correlation coefficient (R) of 0.541 and weighted average of 10.9%. Similarly, the statistical analysis conducted on geographies consisting of 195,454,618 people shows a poor positive correlation between the proportion of Immigrants from Czechoslovakia and percentage of population with a disability in the United States with a correlation coefficient (R) of 0.185 and weighted average of 11.2%, a difference of 3.4%.
Disability Correlation Summary
| Measurement | Immigrants from Spain | Immigrants from Czechoslovakia |
| Minimum | 1.9% | 2.7% |
| Maximum | 43.1% | 37.8% |
| Range | 41.2% | 35.2% |
| Mean | 12.7% | 13.1% |
| Median | 11.0% | 11.9% |
| Interquartile 25% (IQ1) | 8.7% | 10.3% |
| Interquartile 75% (IQ3) | 13.8% | 14.2% |
| Interquartile Range (IQR) | 5.1% | 3.9% |
| Standard Deviation (Sample) | 7.2% | 5.7% |
| Standard Deviation (Population) | 7.1% | 5.7% |
Similar Demographics by Disability
Demographics Similar to Immigrants from Spain by Disability
In terms of disability, the demographic groups most similar to Immigrants from Spain are Jordanian (10.9%, a difference of 0.0%), South American (10.9%, a difference of 0.020%), Peruvian (10.9%, a difference of 0.080%), Vietnamese (10.9%, a difference of 0.090%), and Immigrants from Saudi Arabia (10.9%, a difference of 0.090%).
| Demographics | Rating | Rank | Disability |
| Tongans | 99.9 /100 | #46 | Exceptional 10.8% |
| Taiwanese | 99.9 /100 | #47 | Exceptional 10.8% |
| Soviet Union | 99.9 /100 | #48 | Exceptional 10.9% |
| Vietnamese | 99.9 /100 | #49 | Exceptional 10.9% |
| Immigrants | Saudi Arabia | 99.9 /100 | #50 | Exceptional 10.9% |
| Peruvians | 99.8 /100 | #51 | Exceptional 10.9% |
| South Americans | 99.8 /100 | #52 | Exceptional 10.9% |
| Immigrants | Spain | 99.8 /100 | #53 | Exceptional 10.9% |
| Jordanians | 99.8 /100 | #54 | Exceptional 10.9% |
| Immigrants | El Salvador | 99.8 /100 | #55 | Exceptional 10.9% |
| Immigrants | Lithuania | 99.8 /100 | #56 | Exceptional 10.9% |
| Salvadorans | 99.8 /100 | #57 | Exceptional 10.9% |
| Immigrants | South America | 99.8 /100 | #58 | Exceptional 10.9% |
| Immigrants | Colombia | 99.7 /100 | #59 | Exceptional 10.9% |
| Zimbabweans | 99.7 /100 | #60 | Exceptional 10.9% |
Demographics Similar to Immigrants from Czechoslovakia by Disability
In terms of disability, the demographic groups most similar to Immigrants from Czechoslovakia are Bhutanese (11.2%, a difference of 0.010%), Uruguayan (11.2%, a difference of 0.010%), Immigrants from Zimbabwe (11.2%, a difference of 0.15%), Immigrants from Greece (11.3%, a difference of 0.18%), and Immigrants from Morocco (11.2%, a difference of 0.22%).
| Demographics | Rating | Rank | Disability |
| Ecuadorians | 98.0 /100 | #92 | Exceptional 11.2% |
| Immigrants | Ecuador | 98.0 /100 | #93 | Exceptional 11.2% |
| Immigrants | Morocco | 97.8 /100 | #94 | Exceptional 11.2% |
| Eastern Europeans | 97.8 /100 | #95 | Exceptional 11.2% |
| Immigrants | Zimbabwe | 97.7 /100 | #96 | Exceptional 11.2% |
| Bhutanese | 97.4 /100 | #97 | Exceptional 11.2% |
| Uruguayans | 97.4 /100 | #98 | Exceptional 11.2% |
| Immigrants | Czechoslovakia | 97.4 /100 | #99 | Exceptional 11.2% |
| Immigrants | Greece | 96.9 /100 | #100 | Exceptional 11.3% |
| Immigrants | Nicaragua | 96.8 /100 | #101 | Exceptional 11.3% |
| Immigrants | Eastern Africa | 96.7 /100 | #102 | Exceptional 11.3% |
| Immigrants | Uruguay | 96.4 /100 | #103 | Exceptional 11.3% |
| Immigrants | Immigrants | 96.4 /100 | #104 | Exceptional 11.3% |
| Immigrants | Kazakhstan | 96.4 /100 | #105 | Exceptional 11.3% |
| Immigrants | Eastern Europe | 96.3 /100 | #106 | Exceptional 11.3% |