Immigrants from South Eastern Asia vs Immigrants from Somalia Ambulatory Disability
COMPARE
Immigrants from South Eastern Asia
Immigrants from Somalia
Ambulatory Disability
Ambulatory Disability Comparison
Immigrants from South Eastern Asia
Immigrants from Somalia
5.9%
AMBULATORY DISABILITY
93.6/ 100
METRIC RATING
117th/ 347
METRIC RANK
5.8%
AMBULATORY DISABILITY
98.3/ 100
METRIC RATING
97th/ 347
METRIC RANK
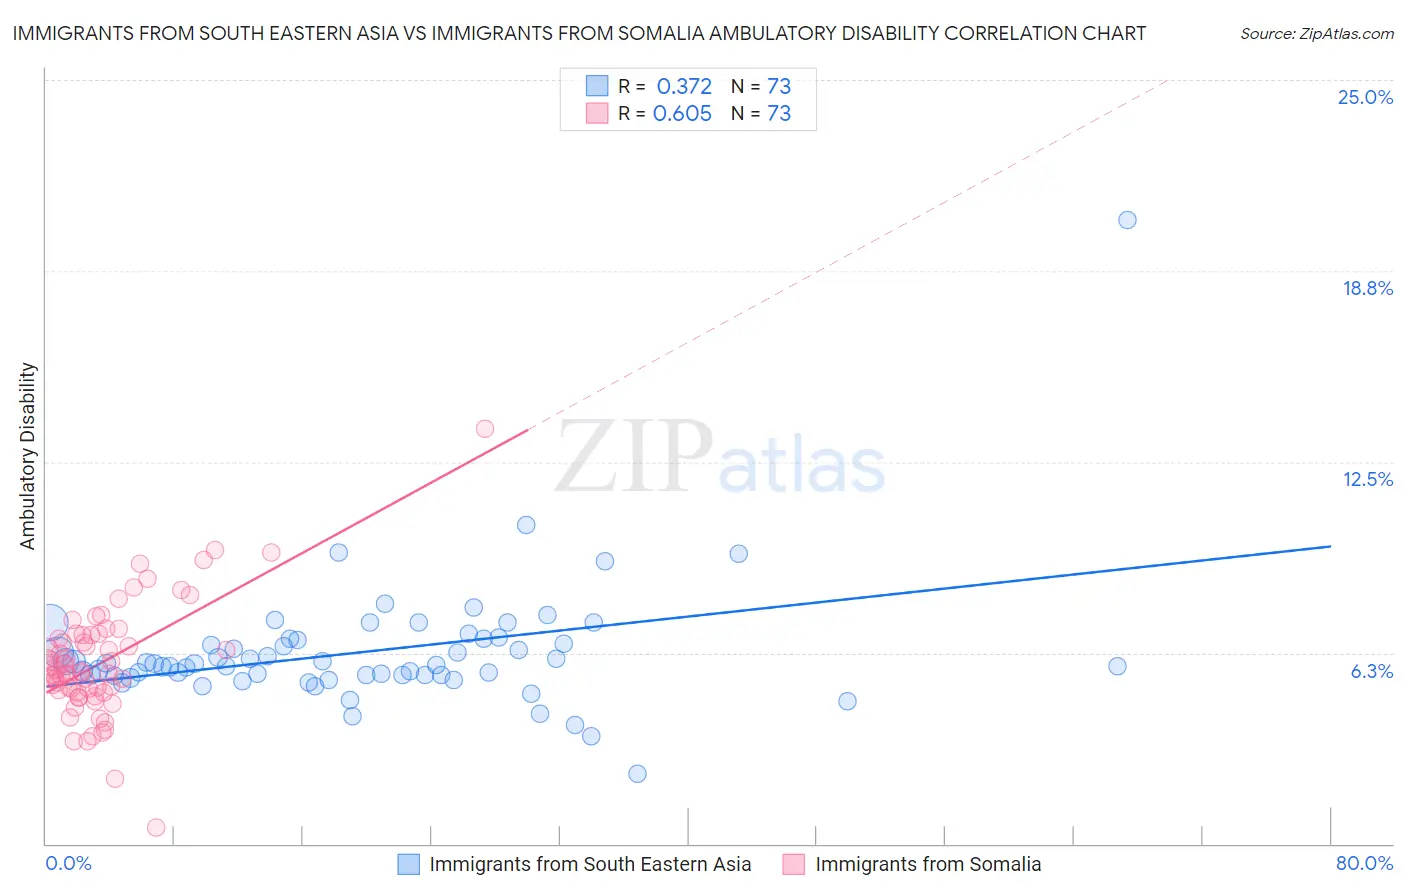
Immigrants from South Eastern Asia vs Immigrants from Somalia Ambulatory Disability Correlation Chart
The statistical analysis conducted on geographies consisting of 512,357,808 people shows a mild positive correlation between the proportion of Immigrants from South Eastern Asia and percentage of population with ambulatory disability in the United States with a correlation coefficient (R) of 0.372 and weighted average of 5.9%. Similarly, the statistical analysis conducted on geographies consisting of 92,104,966 people shows a significant positive correlation between the proportion of Immigrants from Somalia and percentage of population with ambulatory disability in the United States with a correlation coefficient (R) of 0.605 and weighted average of 5.8%, a difference of 1.9%.
Ambulatory Disability Correlation Summary
| Measurement | Immigrants from South Eastern Asia | Immigrants from Somalia |
| Minimum | 2.3% | 0.52% |
| Maximum | 20.4% | 13.6% |
| Range | 18.1% | 13.1% |
| Mean | 6.3% | 5.9% |
| Median | 5.9% | 5.7% |
| Interquartile 25% (IQ1) | 5.5% | 5.0% |
| Interquartile 75% (IQ3) | 6.7% | 6.8% |
| Interquartile Range (IQR) | 1.2% | 1.8% |
| Standard Deviation (Sample) | 2.1% | 1.9% |
| Standard Deviation (Population) | 2.1% | 1.9% |
Demographics Similar to Immigrants from South Eastern Asia and Immigrants from Somalia by Ambulatory Disability
In terms of ambulatory disability, the demographic groups most similar to Immigrants from South Eastern Asia are Immigrants from Africa (5.9%, a difference of 0.28%), South American Indian (5.9%, a difference of 0.29%), Immigrants from Poland (5.9%, a difference of 0.50%), Immigrants from Uruguay (5.9%, a difference of 0.56%), and South African (5.9%, a difference of 0.78%). Similarly, the demographic groups most similar to Immigrants from Somalia are Immigrants from Lebanon (5.8%, a difference of 0.020%), Immigrants from Northern Europe (5.8%, a difference of 0.11%), Immigrants from Serbia (5.8%, a difference of 0.30%), Immigrants from South America (5.8%, a difference of 0.31%), and Immigrants from Kenya (5.8%, a difference of 0.38%).
| Demographics | Rating | Rank | Ambulatory Disability |
| Immigrants | Somalia | 98.3 /100 | #97 | Exceptional 5.8% |
| Immigrants | Lebanon | 98.3 /100 | #98 | Exceptional 5.8% |
| Immigrants | Northern Europe | 98.2 /100 | #99 | Exceptional 5.8% |
| Immigrants | Serbia | 97.9 /100 | #100 | Exceptional 5.8% |
| Immigrants | South America | 97.9 /100 | #101 | Exceptional 5.8% |
| Immigrants | Kenya | 97.8 /100 | #102 | Exceptional 5.8% |
| Immigrants | Romania | 97.7 /100 | #103 | Exceptional 5.8% |
| New Zealanders | 97.6 /100 | #104 | Exceptional 5.8% |
| Immigrants | Czechoslovakia | 97.4 /100 | #105 | Exceptional 5.8% |
| Immigrants | Morocco | 97.3 /100 | #106 | Exceptional 5.8% |
| Uruguayans | 97.2 /100 | #107 | Exceptional 5.8% |
| Colombians | 97.2 /100 | #108 | Exceptional 5.8% |
| Immigrants | Netherlands | 97.1 /100 | #109 | Exceptional 5.8% |
| Immigrants | Colombia | 96.7 /100 | #110 | Exceptional 5.8% |
| Danes | 96.6 /100 | #111 | Exceptional 5.8% |
| South Africans | 96.3 /100 | #112 | Exceptional 5.9% |
| Immigrants | Uruguay | 95.6 /100 | #113 | Exceptional 5.9% |
| Immigrants | Poland | 95.4 /100 | #114 | Exceptional 5.9% |
| South American Indians | 94.8 /100 | #115 | Exceptional 5.9% |
| Immigrants | Africa | 94.7 /100 | #116 | Exceptional 5.9% |
| Immigrants | South Eastern Asia | 93.6 /100 | #117 | Exceptional 5.9% |