Paraguayan vs Immigrants from Somalia Ambulatory Disability
COMPARE
Paraguayan
Immigrants from Somalia
Ambulatory Disability
Ambulatory Disability Comparison
Paraguayans
Immigrants from Somalia
5.5%
AMBULATORY DISABILITY
99.9/ 100
METRIC RATING
43rd/ 347
METRIC RANK
5.8%
AMBULATORY DISABILITY
98.3/ 100
METRIC RATING
97th/ 347
METRIC RANK
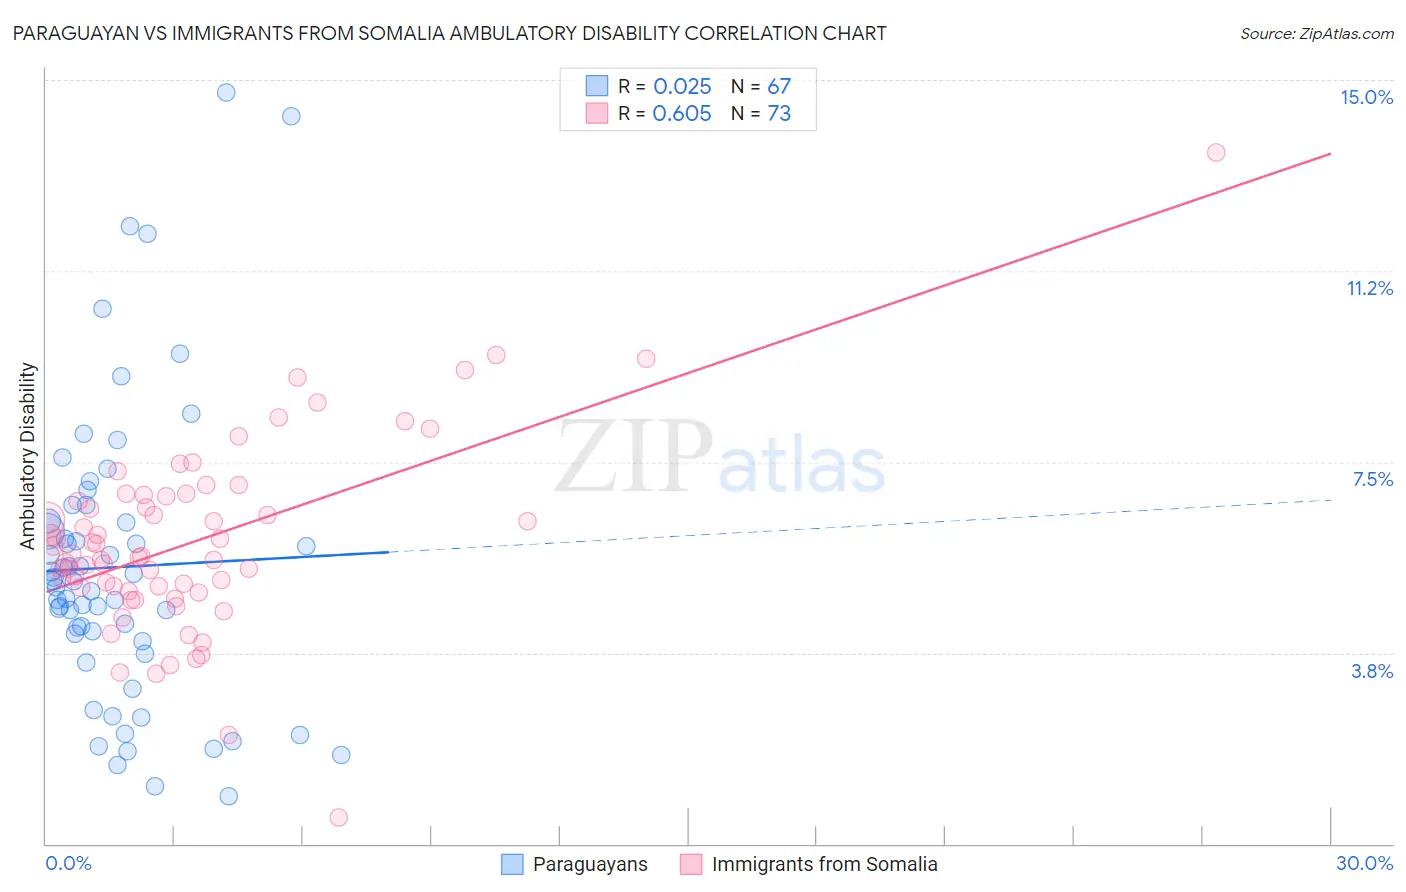
Paraguayan vs Immigrants from Somalia Ambulatory Disability Correlation Chart
The statistical analysis conducted on geographies consisting of 95,109,897 people shows no correlation between the proportion of Paraguayans and percentage of population with ambulatory disability in the United States with a correlation coefficient (R) of 0.025 and weighted average of 5.5%. Similarly, the statistical analysis conducted on geographies consisting of 92,104,966 people shows a significant positive correlation between the proportion of Immigrants from Somalia and percentage of population with ambulatory disability in the United States with a correlation coefficient (R) of 0.605 and weighted average of 5.8%, a difference of 4.5%.
Ambulatory Disability Correlation Summary
| Measurement | Paraguayan | Immigrants from Somalia |
| Minimum | 0.94% | 0.52% |
| Maximum | 14.7% | 13.6% |
| Range | 13.8% | 13.1% |
| Mean | 5.4% | 5.9% |
| Median | 5.2% | 5.7% |
| Interquartile 25% (IQ1) | 4.0% | 5.0% |
| Interquartile 75% (IQ3) | 6.3% | 6.8% |
| Interquartile Range (IQR) | 2.4% | 1.8% |
| Standard Deviation (Sample) | 2.9% | 1.9% |
| Standard Deviation (Population) | 2.8% | 1.9% |
Similar Demographics by Ambulatory Disability
Demographics Similar to Paraguayans by Ambulatory Disability
In terms of ambulatory disability, the demographic groups most similar to Paraguayans are Immigrants from Indonesia (5.5%, a difference of 0.12%), Immigrants from Sweden (5.6%, a difference of 0.28%), Egyptian (5.6%, a difference of 0.29%), Immigrants from Japan (5.6%, a difference of 0.30%), and Immigrants from Argentina (5.6%, a difference of 0.31%).
| Demographics | Rating | Rank | Ambulatory Disability |
| Immigrants | Malaysia | 100.0 /100 | #36 | Exceptional 5.5% |
| Turks | 100.0 /100 | #37 | Exceptional 5.5% |
| Cypriots | 100.0 /100 | #38 | Exceptional 5.5% |
| Immigrants | Eritrea | 100.0 /100 | #39 | Exceptional 5.5% |
| Venezuelans | 99.9 /100 | #40 | Exceptional 5.5% |
| Mongolians | 99.9 /100 | #41 | Exceptional 5.5% |
| Argentineans | 99.9 /100 | #42 | Exceptional 5.5% |
| Paraguayans | 99.9 /100 | #43 | Exceptional 5.5% |
| Immigrants | Indonesia | 99.9 /100 | #44 | Exceptional 5.5% |
| Immigrants | Sweden | 99.9 /100 | #45 | Exceptional 5.6% |
| Egyptians | 99.9 /100 | #46 | Exceptional 5.6% |
| Immigrants | Japan | 99.9 /100 | #47 | Exceptional 5.6% |
| Immigrants | Argentina | 99.9 /100 | #48 | Exceptional 5.6% |
| Bulgarians | 99.9 /100 | #49 | Exceptional 5.6% |
| Luxembourgers | 99.9 /100 | #50 | Exceptional 5.6% |
Demographics Similar to Immigrants from Somalia by Ambulatory Disability
In terms of ambulatory disability, the demographic groups most similar to Immigrants from Somalia are Immigrants from Lebanon (5.8%, a difference of 0.020%), Salvadoran (5.8%, a difference of 0.040%), Immigrants from El Salvador (5.8%, a difference of 0.060%), Kenyan (5.8%, a difference of 0.10%), and Immigrants from Northern Europe (5.8%, a difference of 0.11%).
| Demographics | Rating | Rank | Ambulatory Disability |
| Australians | 98.8 /100 | #90 | Exceptional 5.8% |
| Immigrants | Sudan | 98.8 /100 | #91 | Exceptional 5.8% |
| Immigrants | Sierra Leone | 98.6 /100 | #92 | Exceptional 5.8% |
| Immigrants | Denmark | 98.6 /100 | #93 | Exceptional 5.8% |
| Kenyans | 98.4 /100 | #94 | Exceptional 5.8% |
| Immigrants | El Salvador | 98.4 /100 | #95 | Exceptional 5.8% |
| Salvadorans | 98.4 /100 | #96 | Exceptional 5.8% |
| Immigrants | Somalia | 98.3 /100 | #97 | Exceptional 5.8% |
| Immigrants | Lebanon | 98.3 /100 | #98 | Exceptional 5.8% |
| Immigrants | Northern Europe | 98.2 /100 | #99 | Exceptional 5.8% |
| Immigrants | Serbia | 97.9 /100 | #100 | Exceptional 5.8% |
| Immigrants | South America | 97.9 /100 | #101 | Exceptional 5.8% |
| Immigrants | Kenya | 97.8 /100 | #102 | Exceptional 5.8% |
| Immigrants | Romania | 97.7 /100 | #103 | Exceptional 5.8% |
| New Zealanders | 97.6 /100 | #104 | Exceptional 5.8% |