Immigrants from South Eastern Asia vs Immigrants from Peru Ambulatory Disability
COMPARE
Immigrants from South Eastern Asia
Immigrants from Peru
Ambulatory Disability
Ambulatory Disability Comparison
Immigrants from South Eastern Asia
Immigrants from Peru
5.9%
AMBULATORY DISABILITY
93.6/ 100
METRIC RATING
117th/ 347
METRIC RANK
5.7%
AMBULATORY DISABILITY
99.4/ 100
METRIC RATING
71st/ 347
METRIC RANK
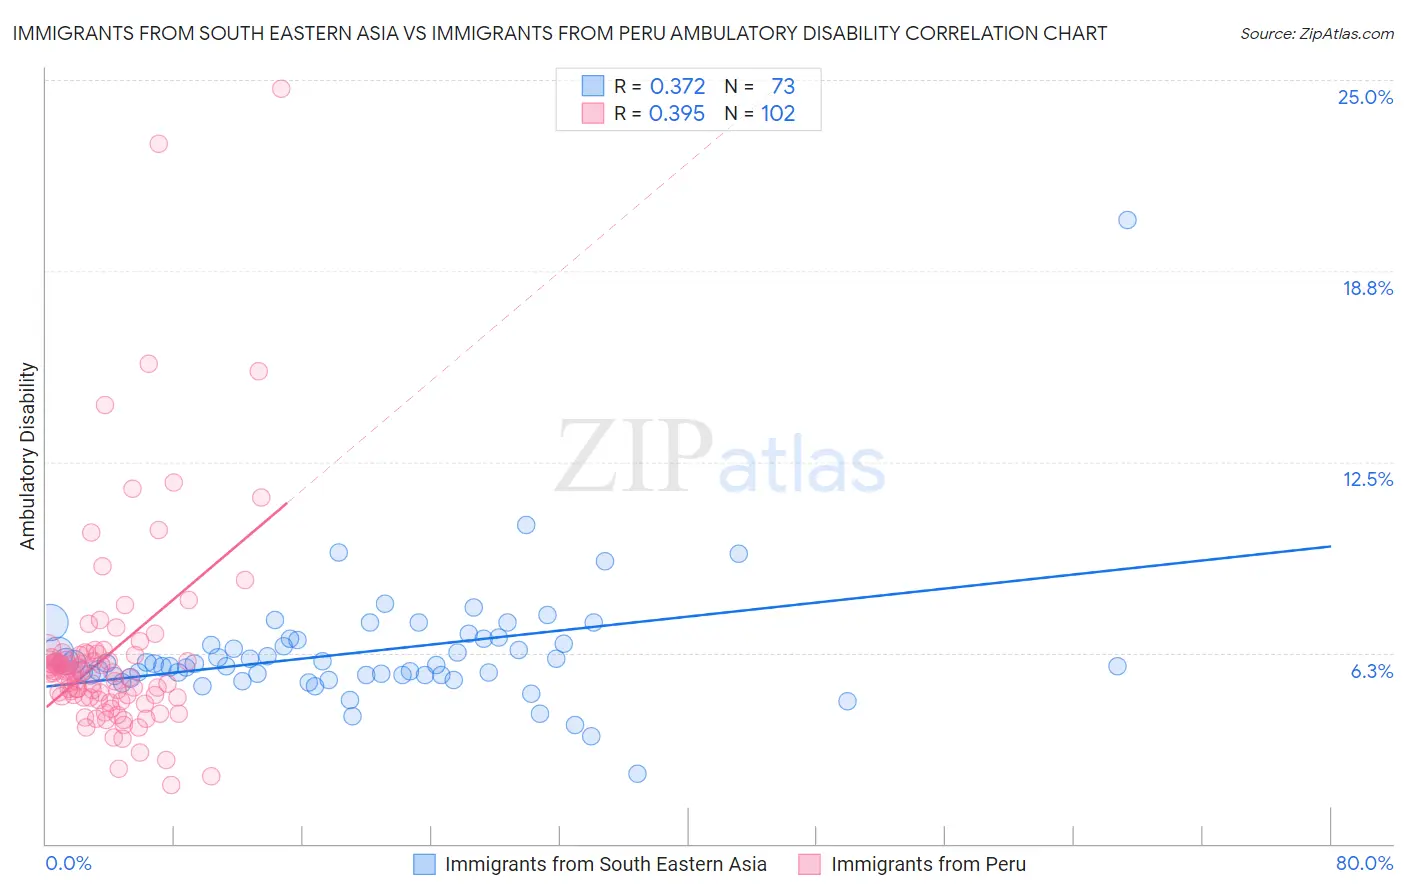
Immigrants from South Eastern Asia vs Immigrants from Peru Ambulatory Disability Correlation Chart
The statistical analysis conducted on geographies consisting of 512,357,808 people shows a mild positive correlation between the proportion of Immigrants from South Eastern Asia and percentage of population with ambulatory disability in the United States with a correlation coefficient (R) of 0.372 and weighted average of 5.9%. Similarly, the statistical analysis conducted on geographies consisting of 328,808,215 people shows a mild positive correlation between the proportion of Immigrants from Peru and percentage of population with ambulatory disability in the United States with a correlation coefficient (R) of 0.395 and weighted average of 5.7%, a difference of 3.4%.
Ambulatory Disability Correlation Summary
| Measurement | Immigrants from South Eastern Asia | Immigrants from Peru |
| Minimum | 2.3% | 1.9% |
| Maximum | 20.4% | 24.7% |
| Range | 18.1% | 22.8% |
| Mean | 6.3% | 6.2% |
| Median | 5.9% | 5.6% |
| Interquartile 25% (IQ1) | 5.5% | 4.8% |
| Interquartile 75% (IQ3) | 6.7% | 6.2% |
| Interquartile Range (IQR) | 1.2% | 1.4% |
| Standard Deviation (Sample) | 2.1% | 3.4% |
| Standard Deviation (Population) | 2.1% | 3.4% |
Similar Demographics by Ambulatory Disability
Demographics Similar to Immigrants from South Eastern Asia by Ambulatory Disability
In terms of ambulatory disability, the demographic groups most similar to Immigrants from South Eastern Asia are Russian (5.9%, a difference of 0.040%), Norwegian (5.9%, a difference of 0.11%), Estonian (5.9%, a difference of 0.15%), Costa Rican (5.9%, a difference of 0.22%), and Icelander (5.9%, a difference of 0.22%).
| Demographics | Rating | Rank | Ambulatory Disability |
| Immigrants | Colombia | 96.7 /100 | #110 | Exceptional 5.8% |
| Danes | 96.6 /100 | #111 | Exceptional 5.8% |
| South Africans | 96.3 /100 | #112 | Exceptional 5.9% |
| Immigrants | Uruguay | 95.6 /100 | #113 | Exceptional 5.9% |
| Immigrants | Poland | 95.4 /100 | #114 | Exceptional 5.9% |
| South American Indians | 94.8 /100 | #115 | Exceptional 5.9% |
| Immigrants | Africa | 94.7 /100 | #116 | Exceptional 5.9% |
| Immigrants | South Eastern Asia | 93.6 /100 | #117 | Exceptional 5.9% |
| Russians | 93.4 /100 | #118 | Exceptional 5.9% |
| Norwegians | 93.1 /100 | #119 | Exceptional 5.9% |
| Estonians | 92.9 /100 | #120 | Exceptional 5.9% |
| Costa Ricans | 92.6 /100 | #121 | Exceptional 5.9% |
| Icelanders | 92.6 /100 | #122 | Exceptional 5.9% |
| Immigrants | Russia | 92.4 /100 | #123 | Exceptional 5.9% |
| Immigrants | Middle Africa | 92.2 /100 | #124 | Exceptional 5.9% |
Demographics Similar to Immigrants from Peru by Ambulatory Disability
In terms of ambulatory disability, the demographic groups most similar to Immigrants from Peru are Brazilian (5.7%, a difference of 0.020%), Immigrants from Northern Africa (5.7%, a difference of 0.040%), Immigrants from Cameroon (5.7%, a difference of 0.040%), Sierra Leonean (5.7%, a difference of 0.090%), and Immigrants from South Africa (5.7%, a difference of 0.090%).
| Demographics | Rating | Rank | Ambulatory Disability |
| Laotians | 99.7 /100 | #64 | Exceptional 5.7% |
| Immigrants | Switzerland | 99.7 /100 | #65 | Exceptional 5.7% |
| Israelis | 99.6 /100 | #66 | Exceptional 5.7% |
| Immigrants | Uganda | 99.6 /100 | #67 | Exceptional 5.7% |
| Sri Lankans | 99.6 /100 | #68 | Exceptional 5.7% |
| Peruvians | 99.5 /100 | #69 | Exceptional 5.7% |
| Sierra Leoneans | 99.4 /100 | #70 | Exceptional 5.7% |
| Immigrants | Peru | 99.4 /100 | #71 | Exceptional 5.7% |
| Brazilians | 99.4 /100 | #72 | Exceptional 5.7% |
| Immigrants | Northern Africa | 99.4 /100 | #73 | Exceptional 5.7% |
| Immigrants | Cameroon | 99.4 /100 | #74 | Exceptional 5.7% |
| Immigrants | South Africa | 99.3 /100 | #75 | Exceptional 5.7% |
| Sudanese | 99.3 /100 | #76 | Exceptional 5.7% |
| Immigrants | Vietnam | 99.3 /100 | #77 | Exceptional 5.7% |
| Somalis | 99.2 /100 | #78 | Exceptional 5.7% |