Immigrants from South America vs Venezuelan Disability Age Over 75
COMPARE
Immigrants from South America
Venezuelan
Disability Age Over 75
Disability Age Over 75 Comparison
Immigrants from South America
Venezuelans
46.7%
DISABILITY AGE OVER 75
91.8/ 100
METRIC RATING
124th/ 347
METRIC RANK
46.9%
DISABILITY AGE OVER 75
85.0/ 100
METRIC RATING
144th/ 347
METRIC RANK
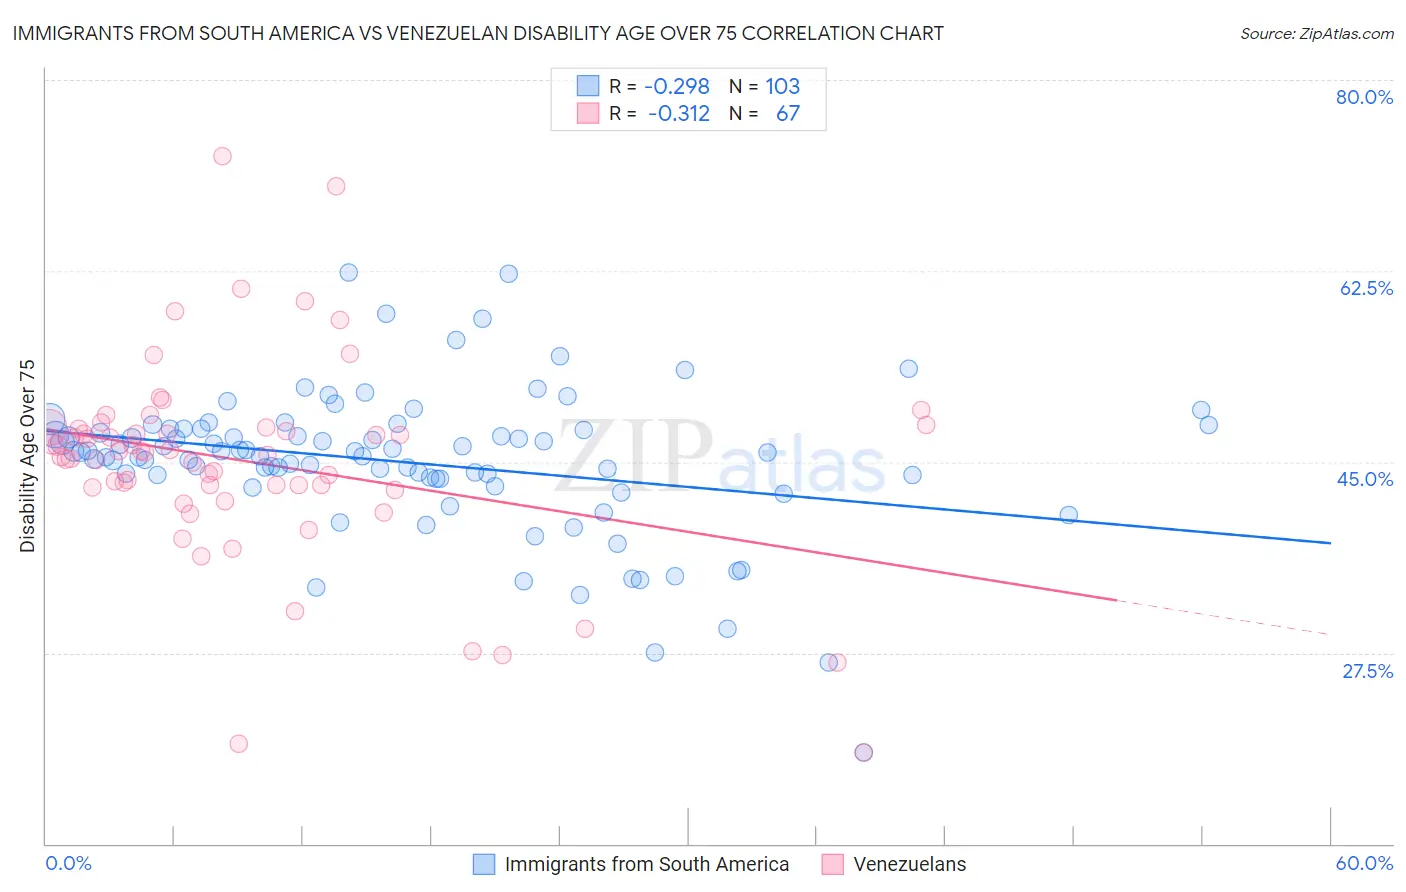
Immigrants from South America vs Venezuelan Disability Age Over 75 Correlation Chart
The statistical analysis conducted on geographies consisting of 485,170,882 people shows a weak negative correlation between the proportion of Immigrants from South America and percentage of population with a disability over the age of 75 in the United States with a correlation coefficient (R) of -0.298 and weighted average of 46.7%. Similarly, the statistical analysis conducted on geographies consisting of 305,815,180 people shows a mild negative correlation between the proportion of Venezuelans and percentage of population with a disability over the age of 75 in the United States with a correlation coefficient (R) of -0.312 and weighted average of 46.9%, a difference of 0.38%.
Disability Age Over 75 Correlation Summary
| Measurement | Immigrants from South America | Venezuelan |
| Minimum | 18.4% | 18.4% |
| Maximum | 62.4% | 73.0% |
| Range | 44.0% | 54.6% |
| Mean | 45.0% | 45.0% |
| Median | 45.9% | 45.9% |
| Interquartile 25% (IQ1) | 43.4% | 42.7% |
| Interquartile 75% (IQ3) | 48.0% | 48.1% |
| Interquartile Range (IQR) | 4.6% | 5.4% |
| Standard Deviation (Sample) | 6.8% | 9.4% |
| Standard Deviation (Population) | 6.7% | 9.3% |
Demographics Similar to Immigrants from South America and Venezuelans by Disability Age Over 75
In terms of disability age over 75, the demographic groups most similar to Immigrants from South America are Colombian (46.7%, a difference of 0.030%), European (46.7%, a difference of 0.040%), Syrian (46.7%, a difference of 0.050%), Icelander (46.7%, a difference of 0.060%), and Immigrants from Germany (46.7%, a difference of 0.070%). Similarly, the demographic groups most similar to Venezuelans are Bermudan (46.9%, a difference of 0.020%), Peruvian (46.8%, a difference of 0.070%), Lebanese (46.8%, a difference of 0.090%), Immigrants from Costa Rica (46.8%, a difference of 0.11%), and Immigrants from Uganda (46.8%, a difference of 0.17%).
| Demographics | Rating | Rank | Disability Age Over 75 |
| Immigrants | South America | 91.8 /100 | #124 | Exceptional 46.7% |
| Colombians | 91.3 /100 | #125 | Exceptional 46.7% |
| Europeans | 91.2 /100 | #126 | Exceptional 46.7% |
| Syrians | 91.1 /100 | #127 | Exceptional 46.7% |
| Icelanders | 90.9 /100 | #128 | Exceptional 46.7% |
| Immigrants | Germany | 90.8 /100 | #129 | Exceptional 46.7% |
| Immigrants | Northern Africa | 90.7 /100 | #130 | Exceptional 46.7% |
| Scottish | 90.5 /100 | #131 | Exceptional 46.7% |
| South Americans | 90.0 /100 | #132 | Excellent 46.8% |
| English | 89.4 /100 | #133 | Excellent 46.8% |
| Immigrants | Ethiopia | 89.1 /100 | #134 | Excellent 46.8% |
| Ethiopians | 88.9 /100 | #135 | Excellent 46.8% |
| Immigrants | Venezuela | 88.6 /100 | #136 | Excellent 46.8% |
| Immigrants | Uganda | 88.5 /100 | #137 | Excellent 46.8% |
| Immigrants | Bosnia and Herzegovina | 88.5 /100 | #138 | Excellent 46.8% |
| Yugoslavians | 88.5 /100 | #139 | Excellent 46.8% |
| Immigrants | Costa Rica | 87.4 /100 | #140 | Excellent 46.8% |
| Lebanese | 87.0 /100 | #141 | Excellent 46.8% |
| Peruvians | 86.5 /100 | #142 | Excellent 46.8% |
| Bermudans | 85.6 /100 | #143 | Excellent 46.9% |
| Venezuelans | 85.0 /100 | #144 | Excellent 46.9% |