Immigrants from Lithuania vs Venezuelan Disability Age Over 75
COMPARE
Immigrants from Lithuania
Venezuelan
Disability Age Over 75
Disability Age Over 75 Comparison
Immigrants from Lithuania
Venezuelans
44.9%
DISABILITY AGE OVER 75
100.0/ 100
METRIC RATING
6th/ 347
METRIC RANK
46.9%
DISABILITY AGE OVER 75
85.0/ 100
METRIC RATING
144th/ 347
METRIC RANK
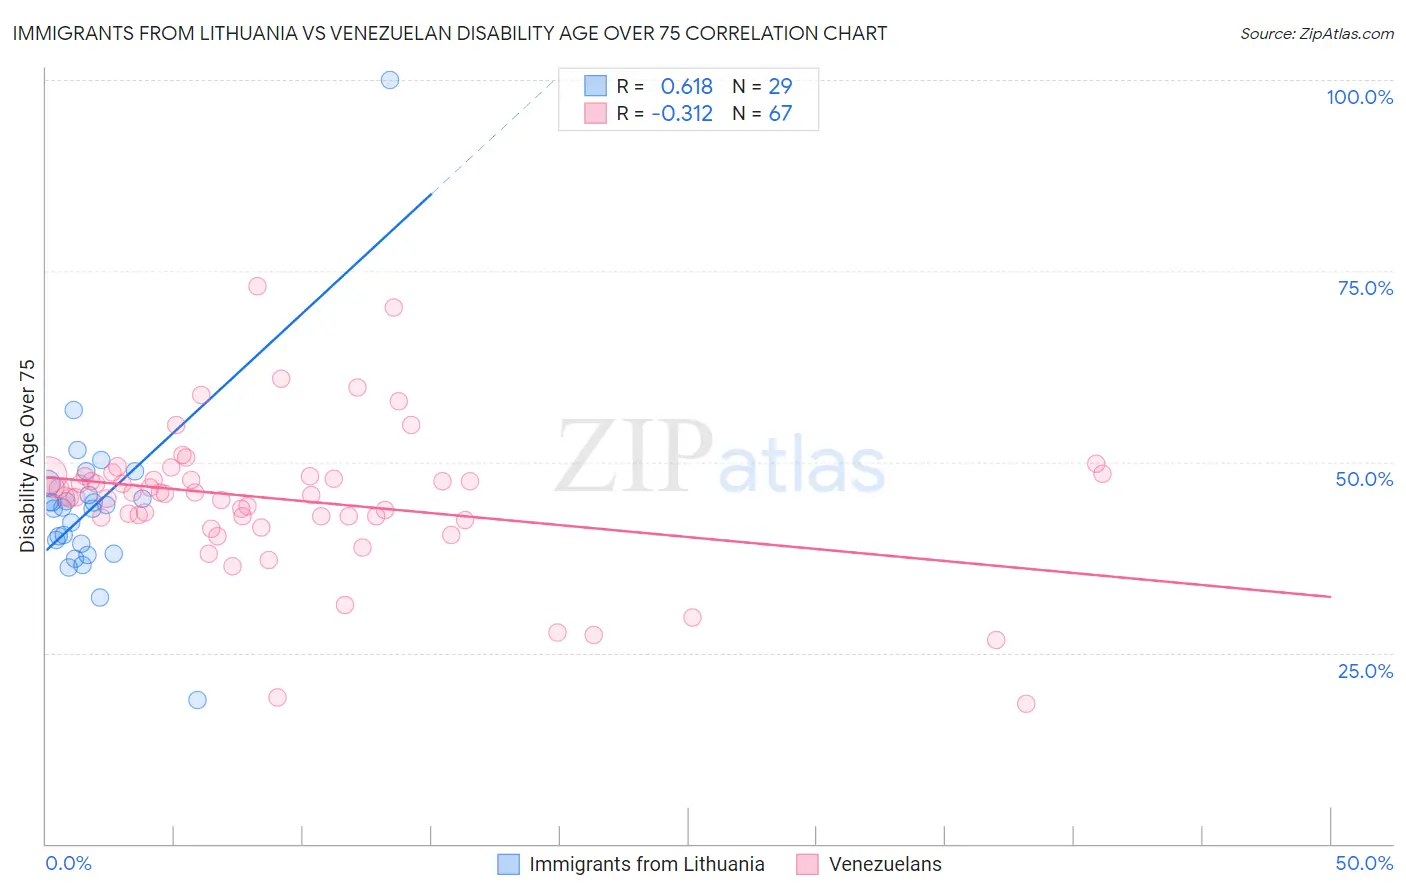
Immigrants from Lithuania vs Venezuelan Disability Age Over 75 Correlation Chart
The statistical analysis conducted on geographies consisting of 117,703,908 people shows a significant positive correlation between the proportion of Immigrants from Lithuania and percentage of population with a disability over the age of 75 in the United States with a correlation coefficient (R) of 0.618 and weighted average of 44.9%. Similarly, the statistical analysis conducted on geographies consisting of 305,815,180 people shows a mild negative correlation between the proportion of Venezuelans and percentage of population with a disability over the age of 75 in the United States with a correlation coefficient (R) of -0.312 and weighted average of 46.9%, a difference of 4.5%.
Disability Age Over 75 Correlation Summary
| Measurement | Immigrants from Lithuania | Venezuelan |
| Minimum | 18.8% | 18.4% |
| Maximum | 100.0% | 73.0% |
| Range | 81.2% | 54.6% |
| Mean | 44.4% | 45.0% |
| Median | 44.1% | 45.9% |
| Interquartile 25% (IQ1) | 38.6% | 42.7% |
| Interquartile 75% (IQ3) | 46.4% | 48.1% |
| Interquartile Range (IQR) | 7.8% | 5.4% |
| Standard Deviation (Sample) | 12.7% | 9.4% |
| Standard Deviation (Population) | 12.5% | 9.3% |
Similar Demographics by Disability Age Over 75
Demographics Similar to Immigrants from Lithuania by Disability Age Over 75
In terms of disability age over 75, the demographic groups most similar to Immigrants from Lithuania are Okinawan (44.9%, a difference of 0.040%), Luxembourger (44.8%, a difference of 0.090%), Carpatho Rusyn (44.8%, a difference of 0.15%), Immigrants from Austria (44.9%, a difference of 0.16%), and Eastern European (44.8%, a difference of 0.18%).
| Demographics | Rating | Rank | Disability Age Over 75 |
| Cypriots | 100.0 /100 | #1 | Exceptional 43.5% |
| Immigrants | Ireland | 100.0 /100 | #2 | Exceptional 44.7% |
| Eastern Europeans | 100.0 /100 | #3 | Exceptional 44.8% |
| Carpatho Rusyns | 100.0 /100 | #4 | Exceptional 44.8% |
| Luxembourgers | 100.0 /100 | #5 | Exceptional 44.8% |
| Immigrants | Lithuania | 100.0 /100 | #6 | Exceptional 44.9% |
| Okinawans | 100.0 /100 | #7 | Exceptional 44.9% |
| Immigrants | Austria | 100.0 /100 | #8 | Exceptional 44.9% |
| Paraguayans | 100.0 /100 | #9 | Exceptional 45.0% |
| Bulgarians | 100.0 /100 | #10 | Exceptional 45.1% |
| Lithuanians | 100.0 /100 | #11 | Exceptional 45.1% |
| Immigrants | Czechoslovakia | 100.0 /100 | #12 | Exceptional 45.1% |
| Latvians | 100.0 /100 | #13 | Exceptional 45.1% |
| Immigrants | Scotland | 100.0 /100 | #14 | Exceptional 45.1% |
| Immigrants | Sweden | 100.0 /100 | #15 | Exceptional 45.1% |
Demographics Similar to Venezuelans by Disability Age Over 75
In terms of disability age over 75, the demographic groups most similar to Venezuelans are Bermudan (46.9%, a difference of 0.020%), Costa Rican (46.9%, a difference of 0.020%), Guyanese (46.9%, a difference of 0.030%), Immigrants from Peru (46.9%, a difference of 0.040%), and Peruvian (46.8%, a difference of 0.070%).
| Demographics | Rating | Rank | Disability Age Over 75 |
| Immigrants | Uganda | 88.5 /100 | #137 | Excellent 46.8% |
| Immigrants | Bosnia and Herzegovina | 88.5 /100 | #138 | Excellent 46.8% |
| Yugoslavians | 88.5 /100 | #139 | Excellent 46.8% |
| Immigrants | Costa Rica | 87.4 /100 | #140 | Excellent 46.8% |
| Lebanese | 87.0 /100 | #141 | Excellent 46.8% |
| Peruvians | 86.5 /100 | #142 | Excellent 46.8% |
| Bermudans | 85.6 /100 | #143 | Excellent 46.9% |
| Venezuelans | 85.0 /100 | #144 | Excellent 46.9% |
| Costa Ricans | 84.5 /100 | #145 | Excellent 46.9% |
| Guyanese | 84.3 /100 | #146 | Excellent 46.9% |
| Immigrants | Peru | 84.1 /100 | #147 | Excellent 46.9% |
| Asians | 81.6 /100 | #148 | Excellent 46.9% |
| Welsh | 81.3 /100 | #149 | Excellent 47.0% |
| Immigrants | Russia | 79.3 /100 | #150 | Good 47.0% |
| French Canadians | 79.0 /100 | #151 | Good 47.0% |