Immigrants from South America vs Yakama Disability Age Over 75
COMPARE
Immigrants from South America
Yakama
Disability Age Over 75
Disability Age Over 75 Comparison
Immigrants from South America
Yakama
46.7%
DISABILITY AGE OVER 75
91.8/ 100
METRIC RATING
124th/ 347
METRIC RANK
51.3%
DISABILITY AGE OVER 75
0.0/ 100
METRIC RATING
317th/ 347
METRIC RANK
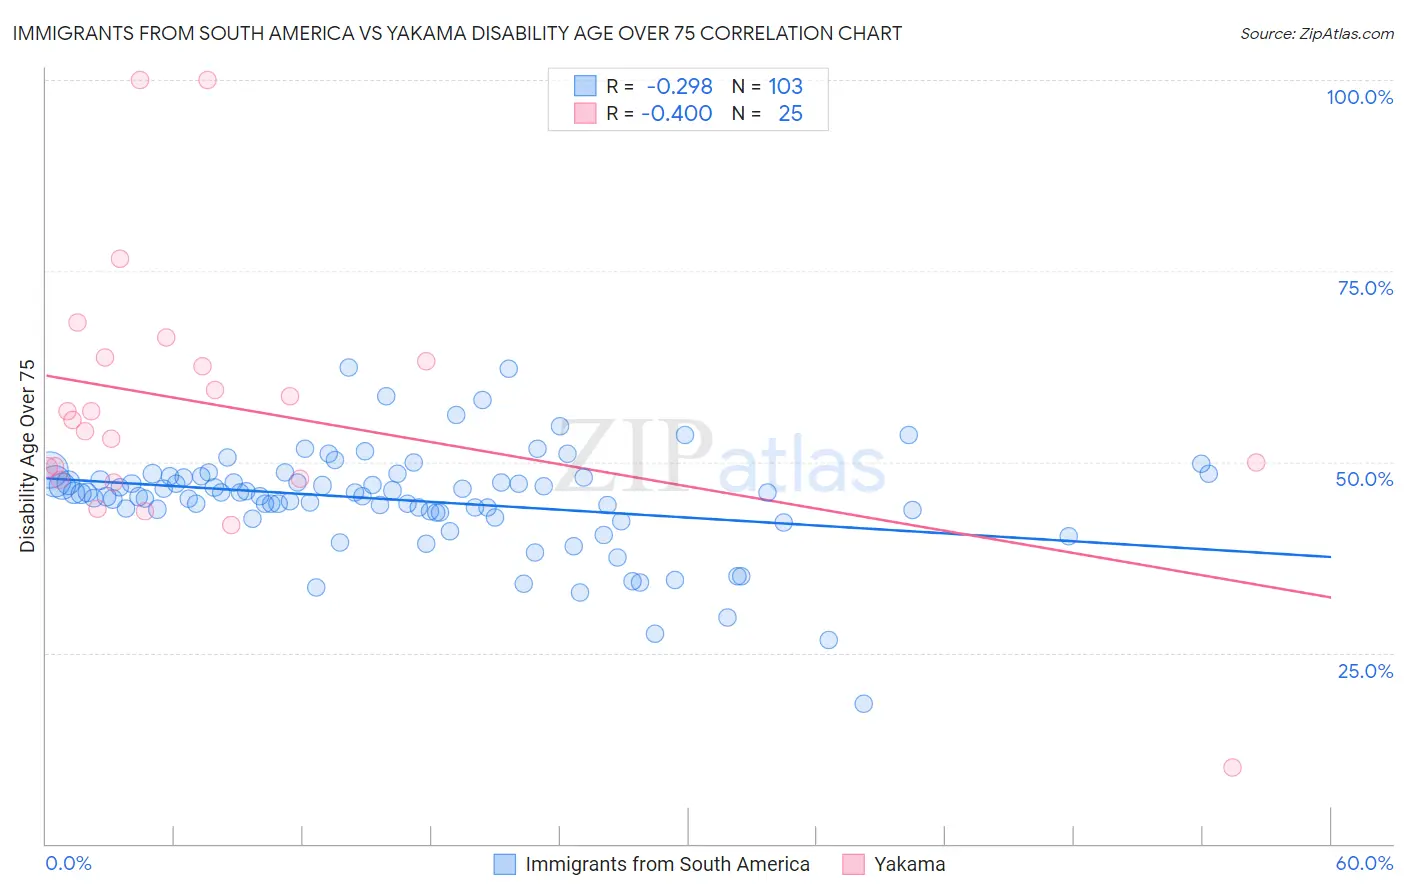
Immigrants from South America vs Yakama Disability Age Over 75 Correlation Chart
The statistical analysis conducted on geographies consisting of 485,170,882 people shows a weak negative correlation between the proportion of Immigrants from South America and percentage of population with a disability over the age of 75 in the United States with a correlation coefficient (R) of -0.298 and weighted average of 46.7%. Similarly, the statistical analysis conducted on geographies consisting of 19,911,140 people shows a moderate negative correlation between the proportion of Yakama and percentage of population with a disability over the age of 75 in the United States with a correlation coefficient (R) of -0.400 and weighted average of 51.3%, a difference of 9.8%.
Disability Age Over 75 Correlation Summary
| Measurement | Immigrants from South America | Yakama |
| Minimum | 18.4% | 10.0% |
| Maximum | 62.4% | 100.0% |
| Range | 44.0% | 90.0% |
| Mean | 45.0% | 57.0% |
| Median | 45.9% | 55.5% |
| Interquartile 25% (IQ1) | 43.4% | 47.8% |
| Interquartile 75% (IQ3) | 48.0% | 63.4% |
| Interquartile Range (IQR) | 4.6% | 15.6% |
| Standard Deviation (Sample) | 6.8% | 17.9% |
| Standard Deviation (Population) | 6.7% | 17.5% |
Similar Demographics by Disability Age Over 75
Demographics Similar to Immigrants from South America by Disability Age Over 75
In terms of disability age over 75, the demographic groups most similar to Immigrants from South America are Colombian (46.7%, a difference of 0.030%), European (46.7%, a difference of 0.040%), Syrian (46.7%, a difference of 0.050%), Immigrants from Colombia (46.7%, a difference of 0.060%), and Icelander (46.7%, a difference of 0.060%).
| Demographics | Rating | Rank | Disability Age Over 75 |
| Hungarians | 95.3 /100 | #117 | Exceptional 46.5% |
| Czechoslovakians | 94.7 /100 | #118 | Exceptional 46.6% |
| Canadians | 94.4 /100 | #119 | Exceptional 46.6% |
| Immigrants | Nepal | 94.1 /100 | #120 | Exceptional 46.6% |
| Scandinavians | 93.6 /100 | #121 | Exceptional 46.6% |
| Immigrants | Albania | 93.2 /100 | #122 | Exceptional 46.6% |
| Immigrants | Colombia | 92.6 /100 | #123 | Exceptional 46.7% |
| Immigrants | South America | 91.8 /100 | #124 | Exceptional 46.7% |
| Colombians | 91.3 /100 | #125 | Exceptional 46.7% |
| Europeans | 91.2 /100 | #126 | Exceptional 46.7% |
| Syrians | 91.1 /100 | #127 | Exceptional 46.7% |
| Icelanders | 90.9 /100 | #128 | Exceptional 46.7% |
| Immigrants | Germany | 90.8 /100 | #129 | Exceptional 46.7% |
| Immigrants | Northern Africa | 90.7 /100 | #130 | Exceptional 46.7% |
| Scottish | 90.5 /100 | #131 | Exceptional 46.7% |
Demographics Similar to Yakama by Disability Age Over 75
In terms of disability age over 75, the demographic groups most similar to Yakama are Chickasaw (51.2%, a difference of 0.18%), Mexican (51.1%, a difference of 0.32%), Seminole (51.5%, a difference of 0.33%), Creek (51.5%, a difference of 0.33%), and Immigrants from Mexico (51.1%, a difference of 0.37%).
| Demographics | Rating | Rank | Disability Age Over 75 |
| Tlingit-Haida | 0.0 /100 | #310 | Tragic 50.6% |
| Cajuns | 0.0 /100 | #311 | Tragic 50.7% |
| Cheyenne | 0.0 /100 | #312 | Tragic 50.9% |
| Immigrants | Azores | 0.0 /100 | #313 | Tragic 50.9% |
| Immigrants | Mexico | 0.0 /100 | #314 | Tragic 51.1% |
| Mexicans | 0.0 /100 | #315 | Tragic 51.1% |
| Chickasaw | 0.0 /100 | #316 | Tragic 51.2% |
| Yakama | 0.0 /100 | #317 | Tragic 51.3% |
| Seminole | 0.0 /100 | #318 | Tragic 51.5% |
| Creek | 0.0 /100 | #319 | Tragic 51.5% |
| Paiute | 0.0 /100 | #320 | Tragic 51.5% |
| Dutch West Indians | 0.0 /100 | #321 | Tragic 51.5% |
| Comanche | 0.0 /100 | #322 | Tragic 51.7% |
| Immigrants | Yemen | 0.0 /100 | #323 | Tragic 52.0% |
| Menominee | 0.0 /100 | #324 | Tragic 52.3% |