Tsimshian vs Venezuelan Disability Age Over 75
COMPARE
Tsimshian
Venezuelan
Disability Age Over 75
Disability Age Over 75 Comparison
Tsimshian
Venezuelans
59.2%
DISABILITY AGE OVER 75
0.0/ 100
METRIC RATING
346th/ 347
METRIC RANK
46.9%
DISABILITY AGE OVER 75
85.0/ 100
METRIC RATING
144th/ 347
METRIC RANK
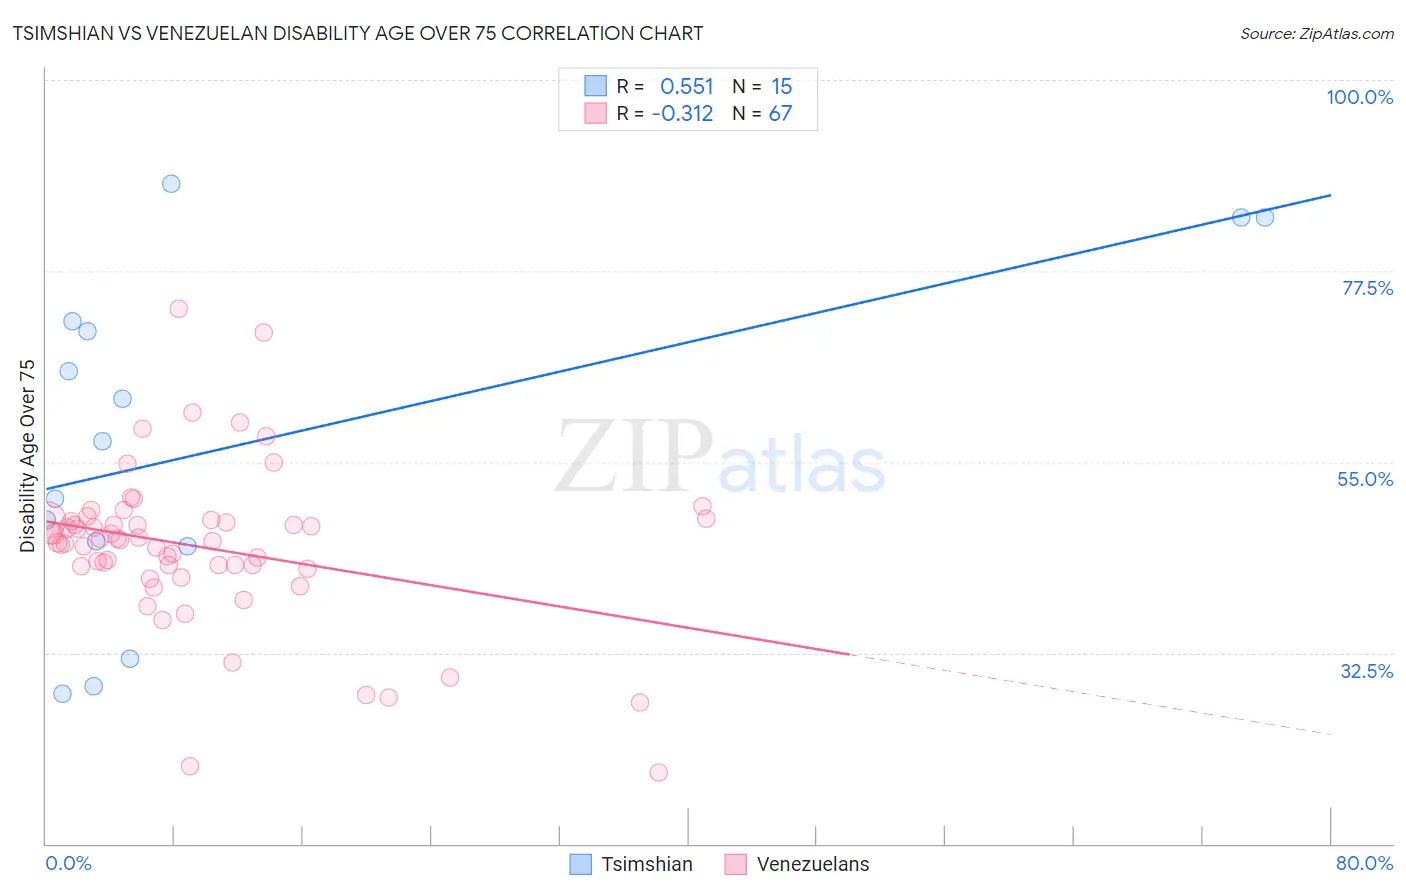
Tsimshian vs Venezuelan Disability Age Over 75 Correlation Chart
The statistical analysis conducted on geographies consisting of 15,620,176 people shows a substantial positive correlation between the proportion of Tsimshian and percentage of population with a disability over the age of 75 in the United States with a correlation coefficient (R) of 0.551 and weighted average of 59.2%. Similarly, the statistical analysis conducted on geographies consisting of 305,815,180 people shows a mild negative correlation between the proportion of Venezuelans and percentage of population with a disability over the age of 75 in the United States with a correlation coefficient (R) of -0.312 and weighted average of 46.9%, a difference of 26.3%.
Disability Age Over 75 Correlation Summary
| Measurement | Tsimshian | Venezuelan |
| Minimum | 27.7% | 18.4% |
| Maximum | 87.8% | 73.0% |
| Range | 60.1% | 54.6% |
| Mean | 57.4% | 45.0% |
| Median | 57.4% | 45.9% |
| Interquartile 25% (IQ1) | 45.0% | 42.7% |
| Interquartile 75% (IQ3) | 71.6% | 48.1% |
| Interquartile Range (IQR) | 26.6% | 5.4% |
| Standard Deviation (Sample) | 20.0% | 9.4% |
| Standard Deviation (Population) | 19.3% | 9.3% |
Similar Demographics by Disability Age Over 75
Demographics Similar to Tsimshian by Disability Age Over 75
In terms of disability age over 75, the demographic groups most similar to Tsimshian are Inupiat (58.4%, a difference of 1.4%), Navajo (58.3%, a difference of 1.6%), Yup'ik (61.1%, a difference of 3.2%), Tohono O'odham (56.7%, a difference of 4.4%), and Lumbee (56.2%, a difference of 5.3%).
| Demographics | Rating | Rank | Disability Age Over 75 |
| Apache | 0.0 /100 | #333 | Tragic 53.6% |
| Alaskan Athabascans | 0.0 /100 | #334 | Tragic 54.0% |
| Kiowa | 0.0 /100 | #335 | Tragic 54.2% |
| Immigrants | Armenia | 0.0 /100 | #336 | Tragic 54.3% |
| Yuman | 0.0 /100 | #337 | Tragic 54.4% |
| Colville | 0.0 /100 | #338 | Tragic 55.4% |
| Pima | 0.0 /100 | #339 | Tragic 55.8% |
| Pueblo | 0.0 /100 | #340 | Tragic 55.9% |
| Houma | 0.0 /100 | #341 | Tragic 56.2% |
| Lumbee | 0.0 /100 | #342 | Tragic 56.2% |
| Tohono O'odham | 0.0 /100 | #343 | Tragic 56.7% |
| Navajo | 0.0 /100 | #344 | Tragic 58.3% |
| Inupiat | 0.0 /100 | #345 | Tragic 58.4% |
| Tsimshian | 0.0 /100 | #346 | Tragic 59.2% |
| Yup'ik | 0.0 /100 | #347 | Tragic 61.1% |
Demographics Similar to Venezuelans by Disability Age Over 75
In terms of disability age over 75, the demographic groups most similar to Venezuelans are Bermudan (46.9%, a difference of 0.020%), Costa Rican (46.9%, a difference of 0.020%), Guyanese (46.9%, a difference of 0.030%), Immigrants from Peru (46.9%, a difference of 0.040%), and Peruvian (46.8%, a difference of 0.070%).
| Demographics | Rating | Rank | Disability Age Over 75 |
| Immigrants | Uganda | 88.5 /100 | #137 | Excellent 46.8% |
| Immigrants | Bosnia and Herzegovina | 88.5 /100 | #138 | Excellent 46.8% |
| Yugoslavians | 88.5 /100 | #139 | Excellent 46.8% |
| Immigrants | Costa Rica | 87.4 /100 | #140 | Excellent 46.8% |
| Lebanese | 87.0 /100 | #141 | Excellent 46.8% |
| Peruvians | 86.5 /100 | #142 | Excellent 46.8% |
| Bermudans | 85.6 /100 | #143 | Excellent 46.9% |
| Venezuelans | 85.0 /100 | #144 | Excellent 46.9% |
| Costa Ricans | 84.5 /100 | #145 | Excellent 46.9% |
| Guyanese | 84.3 /100 | #146 | Excellent 46.9% |
| Immigrants | Peru | 84.1 /100 | #147 | Excellent 46.9% |
| Asians | 81.6 /100 | #148 | Excellent 46.9% |
| Welsh | 81.3 /100 | #149 | Excellent 47.0% |
| Immigrants | Russia | 79.3 /100 | #150 | Good 47.0% |
| French Canadians | 79.0 /100 | #151 | Good 47.0% |