Immigrants from South Africa vs Vietnamese Hearing Disability
COMPARE
Immigrants from South Africa
Vietnamese
Hearing Disability
Hearing Disability Comparison
Immigrants from South Africa
Vietnamese
3.1%
HEARING DISABILITY
31.1/ 100
METRIC RATING
190th/ 347
METRIC RANK
2.4%
HEARING DISABILITY
100.0/ 100
METRIC RATING
6th/ 347
METRIC RANK
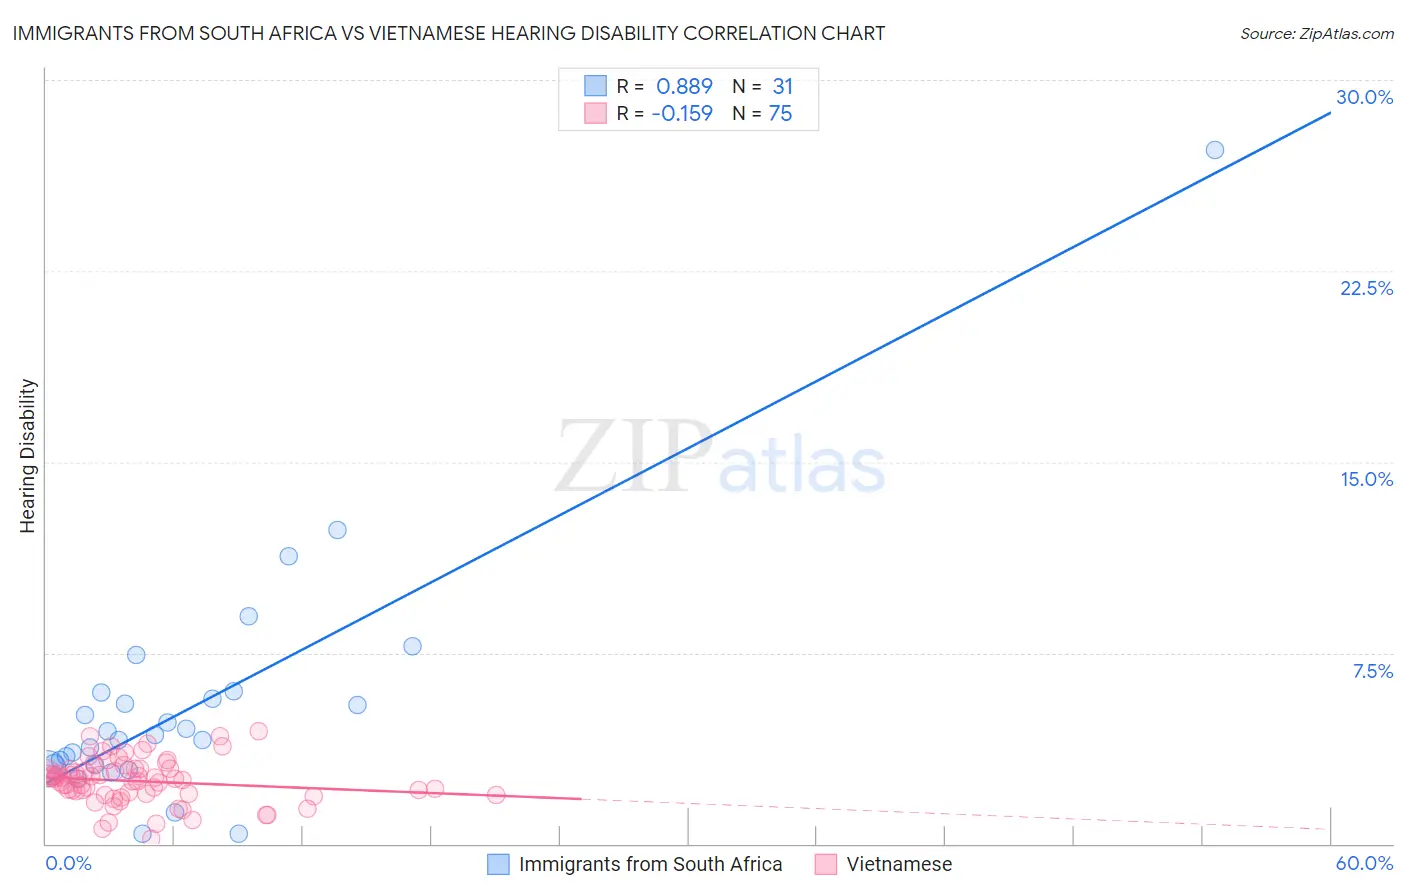
Immigrants from South Africa vs Vietnamese Hearing Disability Correlation Chart
The statistical analysis conducted on geographies consisting of 233,290,036 people shows a very strong positive correlation between the proportion of Immigrants from South Africa and percentage of population with hearing disability in the United States with a correlation coefficient (R) of 0.889 and weighted average of 3.1%. Similarly, the statistical analysis conducted on geographies consisting of 170,714,585 people shows a poor negative correlation between the proportion of Vietnamese and percentage of population with hearing disability in the United States with a correlation coefficient (R) of -0.159 and weighted average of 2.4%, a difference of 27.8%.
Hearing Disability Correlation Summary
| Measurement | Immigrants from South Africa | Vietnamese |
| Minimum | 0.40% | 0.18% |
| Maximum | 27.3% | 4.4% |
| Range | 26.9% | 4.2% |
| Mean | 5.4% | 2.5% |
| Median | 4.3% | 2.6% |
| Interquartile 25% (IQ1) | 3.1% | 1.9% |
| Interquartile 75% (IQ3) | 6.0% | 2.9% |
| Interquartile Range (IQR) | 2.9% | 0.99% |
| Standard Deviation (Sample) | 4.9% | 0.87% |
| Standard Deviation (Population) | 4.8% | 0.87% |
Similar Demographics by Hearing Disability
Demographics Similar to Immigrants from South Africa by Hearing Disability
In terms of hearing disability, the demographic groups most similar to Immigrants from South Africa are African (3.0%, a difference of 0.19%), Immigrants from Switzerland (3.1%, a difference of 0.25%), Black/African American (3.0%, a difference of 0.38%), Mexican American Indian (3.0%, a difference of 0.38%), and Korean (3.1%, a difference of 0.38%).
| Demographics | Rating | Rank | Hearing Disability |
| Bulgarians | 39.7 /100 | #183 | Fair 3.0% |
| Immigrants | Ireland | 37.4 /100 | #184 | Fair 3.0% |
| Immigrants | Southern Europe | 35.3 /100 | #185 | Fair 3.0% |
| Immigrants | Mexico | 34.9 /100 | #186 | Fair 3.0% |
| Blacks/African Americans | 34.7 /100 | #187 | Fair 3.0% |
| Mexican American Indians | 34.7 /100 | #188 | Fair 3.0% |
| Africans | 32.9 /100 | #189 | Fair 3.0% |
| Immigrants | South Africa | 31.1 /100 | #190 | Fair 3.1% |
| Immigrants | Switzerland | 28.8 /100 | #191 | Fair 3.1% |
| Koreans | 27.6 /100 | #192 | Fair 3.1% |
| Macedonians | 27.0 /100 | #193 | Fair 3.1% |
| South Africans | 24.5 /100 | #194 | Fair 3.1% |
| Spanish American Indians | 24.1 /100 | #195 | Fair 3.1% |
| Immigrants | Europe | 22.9 /100 | #196 | Fair 3.1% |
| Immigrants | Bosnia and Herzegovina | 20.6 /100 | #197 | Fair 3.1% |
Demographics Similar to Vietnamese by Hearing Disability
In terms of hearing disability, the demographic groups most similar to Vietnamese are Immigrants from Barbados (2.4%, a difference of 1.1%), Immigrants from Bangladesh (2.4%, a difference of 1.6%), British West Indian (2.4%, a difference of 1.8%), Immigrants from Dominican Republic (2.4%, a difference of 2.6%), and Immigrants from Guyana (2.3%, a difference of 3.0%).
| Demographics | Rating | Rank | Hearing Disability |
| Immigrants | Grenada | 100.0 /100 | #1 | Exceptional 2.2% |
| Immigrants | St. Vincent and the Grenadines | 100.0 /100 | #2 | Exceptional 2.3% |
| Guyanese | 100.0 /100 | #3 | Exceptional 2.3% |
| Immigrants | Guyana | 100.0 /100 | #4 | Exceptional 2.3% |
| Immigrants | Barbados | 100.0 /100 | #5 | Exceptional 2.4% |
| Vietnamese | 100.0 /100 | #6 | Exceptional 2.4% |
| Immigrants | Bangladesh | 100.0 /100 | #7 | Exceptional 2.4% |
| British West Indians | 100.0 /100 | #8 | Exceptional 2.4% |
| Immigrants | Dominican Republic | 100.0 /100 | #9 | Exceptional 2.4% |
| Immigrants | Ecuador | 99.9 /100 | #10 | Exceptional 2.5% |
| Immigrants | Trinidad and Tobago | 99.9 /100 | #11 | Exceptional 2.5% |
| Trinidadians and Tobagonians | 99.9 /100 | #12 | Exceptional 2.5% |
| Sierra Leoneans | 99.9 /100 | #13 | Exceptional 2.5% |
| Ecuadorians | 99.9 /100 | #14 | Exceptional 2.5% |
| Barbadians | 99.9 /100 | #15 | Exceptional 2.5% |