Immigrants from South Africa vs Vietnamese 8th Grade
COMPARE
Immigrants from South Africa
Vietnamese
8th Grade
8th Grade Comparison
Immigrants from South Africa
Vietnamese
96.5%
8TH GRADE
99.1/ 100
METRIC RATING
85th/ 347
METRIC RANK
93.5%
8TH GRADE
0.0/ 100
METRIC RATING
315th/ 347
METRIC RANK
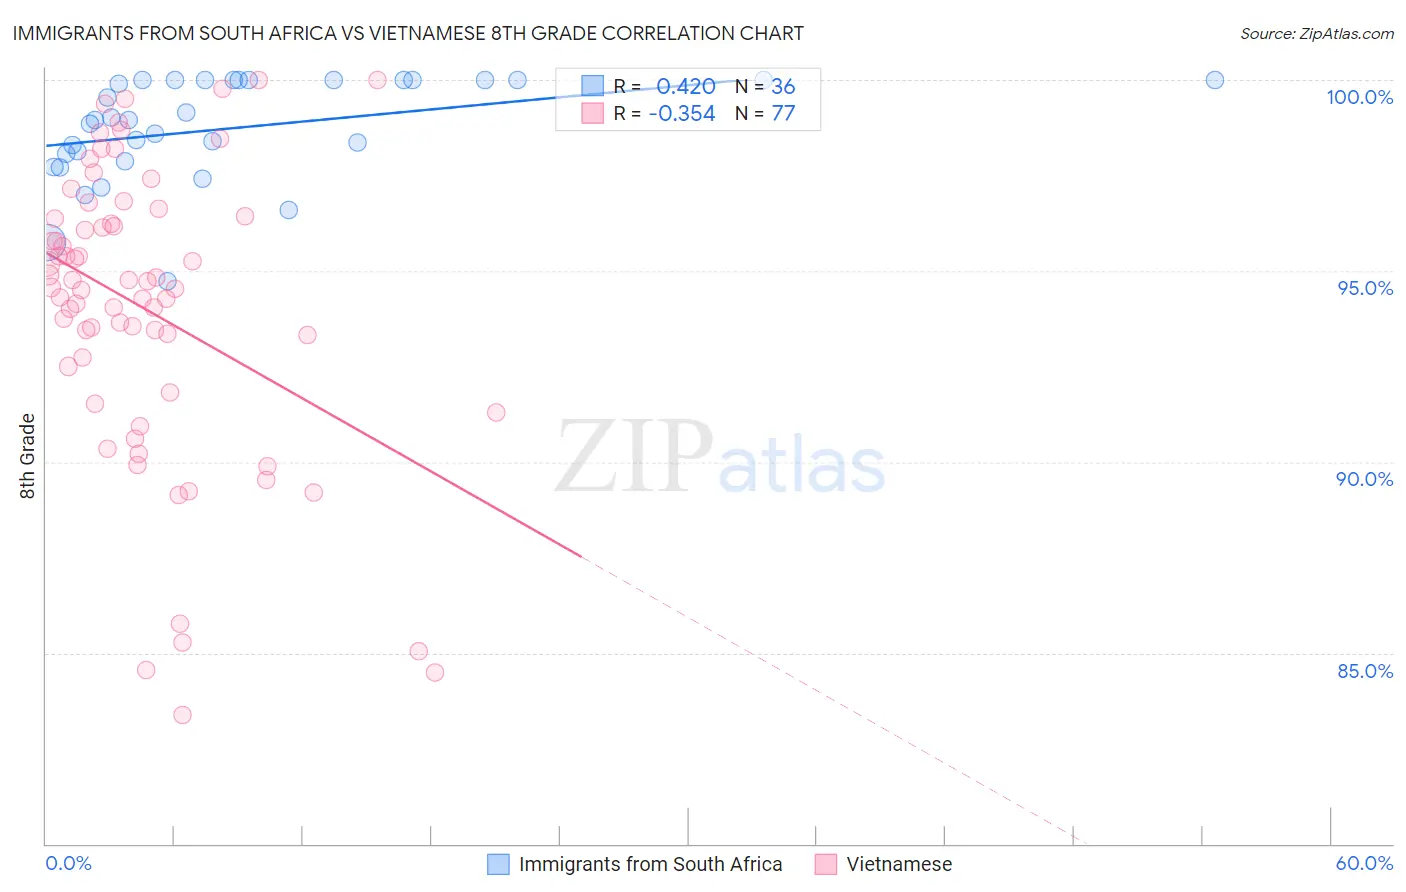
Immigrants from South Africa vs Vietnamese 8th Grade Correlation Chart
The statistical analysis conducted on geographies consisting of 233,321,693 people shows a moderate positive correlation between the proportion of Immigrants from South Africa and percentage of population with at least 8th grade education in the United States with a correlation coefficient (R) of 0.420 and weighted average of 96.5%. Similarly, the statistical analysis conducted on geographies consisting of 170,728,240 people shows a mild negative correlation between the proportion of Vietnamese and percentage of population with at least 8th grade education in the United States with a correlation coefficient (R) of -0.354 and weighted average of 93.5%, a difference of 3.2%.
8th Grade Correlation Summary
| Measurement | Immigrants from South Africa | Vietnamese |
| Minimum | 94.7% | 83.4% |
| Maximum | 100.0% | 100.0% |
| Range | 5.3% | 16.6% |
| Mean | 98.7% | 94.0% |
| Median | 98.9% | 94.6% |
| Interquartile 25% (IQ1) | 98.0% | 92.2% |
| Interquartile 75% (IQ3) | 100.0% | 96.4% |
| Interquartile Range (IQR) | 2.0% | 4.3% |
| Standard Deviation (Sample) | 1.4% | 3.8% |
| Standard Deviation (Population) | 1.3% | 3.8% |
Similar Demographics by 8th Grade
Demographics Similar to Immigrants from South Africa by 8th Grade
In terms of 8th grade, the demographic groups most similar to Immigrants from South Africa are Cherokee (96.5%, a difference of 0.0%), Immigrants from Australia (96.5%, a difference of 0.0%), Immigrants from Belgium (96.5%, a difference of 0.010%), Icelander (96.5%, a difference of 0.020%), and Immigrants from Western Europe (96.4%, a difference of 0.020%).
| Demographics | Rating | Rank | 8th Grade |
| Yugoslavians | 99.4 /100 | #78 | Exceptional 96.5% |
| Puget Sound Salish | 99.3 /100 | #79 | Exceptional 96.5% |
| Delaware | 99.2 /100 | #80 | Exceptional 96.5% |
| Romanians | 99.2 /100 | #81 | Exceptional 96.5% |
| Turks | 99.2 /100 | #82 | Exceptional 96.5% |
| Icelanders | 99.2 /100 | #83 | Exceptional 96.5% |
| Immigrants | Belgium | 99.1 /100 | #84 | Exceptional 96.5% |
| Immigrants | South Africa | 99.1 /100 | #85 | Exceptional 96.5% |
| Cherokee | 99.0 /100 | #86 | Exceptional 96.5% |
| Immigrants | Australia | 99.0 /100 | #87 | Exceptional 96.5% |
| Immigrants | Western Europe | 99.0 /100 | #88 | Exceptional 96.4% |
| Chickasaw | 98.9 /100 | #89 | Exceptional 96.4% |
| Immigrants | Sweden | 98.9 /100 | #90 | Exceptional 96.4% |
| Thais | 98.9 /100 | #91 | Exceptional 96.4% |
| Menominee | 98.9 /100 | #92 | Exceptional 96.4% |
Demographics Similar to Vietnamese by 8th Grade
In terms of 8th grade, the demographic groups most similar to Vietnamese are Immigrants from Vietnam (93.5%, a difference of 0.010%), Immigrants from Caribbean (93.5%, a difference of 0.020%), Cape Verdean (93.5%, a difference of 0.050%), Japanese (93.6%, a difference of 0.090%), and Immigrants from Bangladesh (93.6%, a difference of 0.090%).
| Demographics | Rating | Rank | 8th Grade |
| Ecuadorians | 0.0 /100 | #308 | Tragic 93.6% |
| Immigrants | Immigrants | 0.0 /100 | #309 | Tragic 93.6% |
| Japanese | 0.0 /100 | #310 | Tragic 93.6% |
| Immigrants | Bangladesh | 0.0 /100 | #311 | Tragic 93.6% |
| Cape Verdeans | 0.0 /100 | #312 | Tragic 93.5% |
| Immigrants | Caribbean | 0.0 /100 | #313 | Tragic 93.5% |
| Immigrants | Vietnam | 0.0 /100 | #314 | Tragic 93.5% |
| Vietnamese | 0.0 /100 | #315 | Tragic 93.5% |
| Immigrants | Cambodia | 0.0 /100 | #316 | Tragic 93.3% |
| Immigrants | Ecuador | 0.0 /100 | #317 | Tragic 93.3% |
| Puerto Ricans | 0.0 /100 | #318 | Tragic 93.2% |
| Immigrants | Cuba | 0.0 /100 | #319 | Tragic 93.2% |
| Immigrants | Fiji | 0.0 /100 | #320 | Tragic 93.2% |
| Belizeans | 0.0 /100 | #321 | Tragic 93.1% |
| Nicaraguans | 0.0 /100 | #322 | Tragic 93.0% |