Immigrants from South Africa vs Vietnamese Disability
COMPARE
Immigrants from South Africa
Vietnamese
Disability
Disability Comparison
Immigrants from South Africa
Vietnamese
11.2%
DISABILITY
98.2/ 100
METRIC RATING
89th/ 347
METRIC RANK
10.9%
DISABILITY
99.9/ 100
METRIC RATING
49th/ 347
METRIC RANK
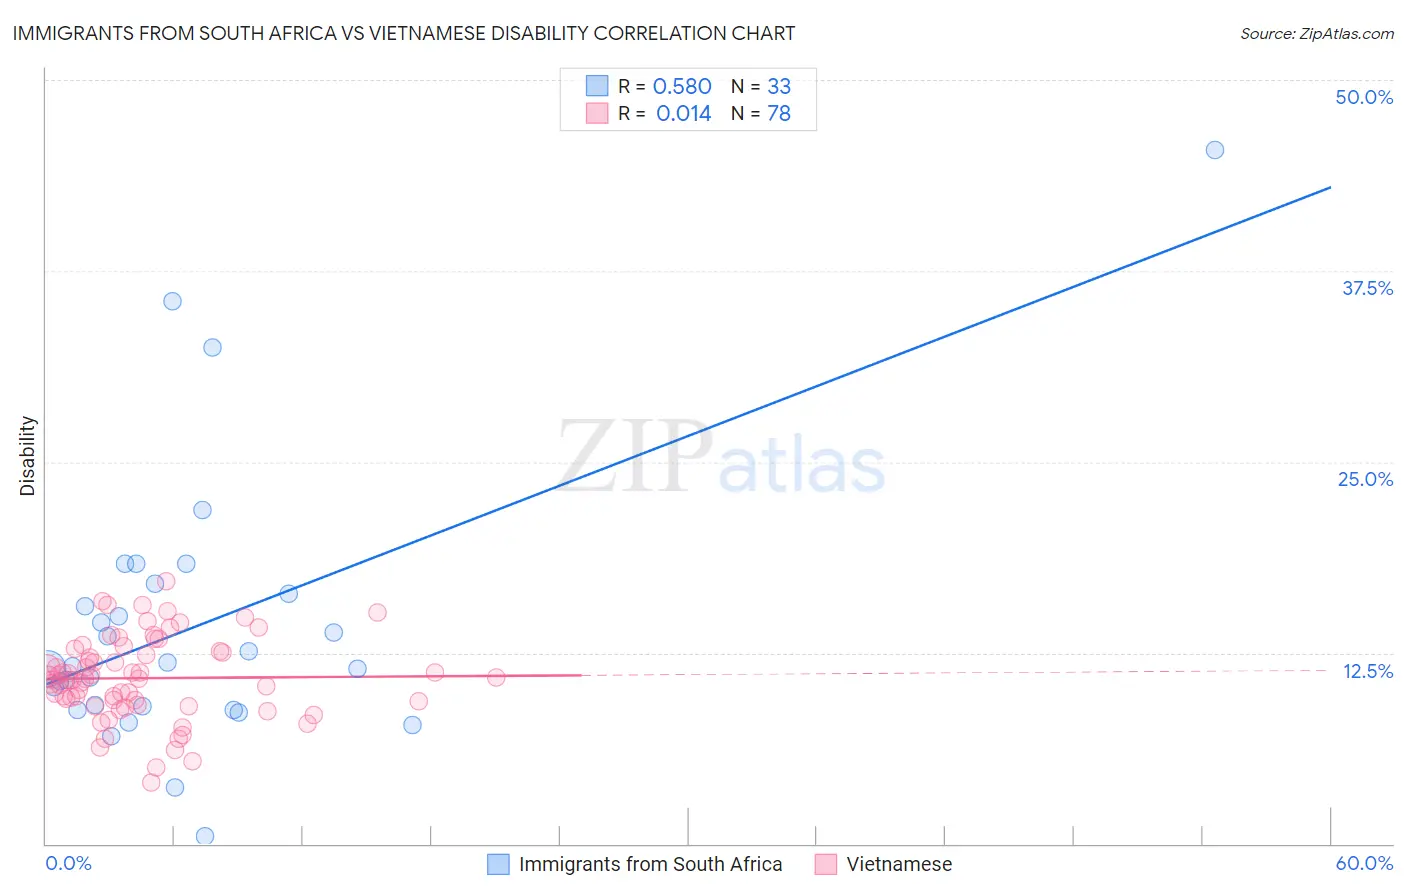
Immigrants from South Africa vs Vietnamese Disability Correlation Chart
The statistical analysis conducted on geographies consisting of 233,313,219 people shows a substantial positive correlation between the proportion of Immigrants from South Africa and percentage of population with a disability in the United States with a correlation coefficient (R) of 0.580 and weighted average of 11.2%. Similarly, the statistical analysis conducted on geographies consisting of 170,758,607 people shows no correlation between the proportion of Vietnamese and percentage of population with a disability in the United States with a correlation coefficient (R) of 0.014 and weighted average of 10.9%, a difference of 3.0%.
Disability Correlation Summary
| Measurement | Immigrants from South Africa | Vietnamese |
| Minimum | 0.46% | 4.0% |
| Maximum | 45.5% | 17.2% |
| Range | 45.0% | 13.2% |
| Mean | 14.2% | 10.8% |
| Median | 11.7% | 10.8% |
| Interquartile 25% (IQ1) | 8.9% | 9.4% |
| Interquartile 75% (IQ3) | 16.7% | 12.6% |
| Interquartile Range (IQR) | 7.8% | 3.2% |
| Standard Deviation (Sample) | 8.9% | 2.7% |
| Standard Deviation (Population) | 8.8% | 2.7% |
Similar Demographics by Disability
Demographics Similar to Immigrants from South Africa by Disability
In terms of disability, the demographic groups most similar to Immigrants from South Africa are Immigrants from Brazil (11.2%, a difference of 0.050%), Immigrants from Western Asia (11.2%, a difference of 0.070%), Ecuadorian (11.2%, a difference of 0.11%), Immigrants from Ecuador (11.2%, a difference of 0.11%), and Immigrants from Morocco (11.2%, a difference of 0.23%).
| Demographics | Rating | Rank | Disability |
| Chileans | 99.1 /100 | #82 | Exceptional 11.1% |
| Immigrants | Switzerland | 99.0 /100 | #83 | Exceptional 11.1% |
| Immigrants | Sierra Leone | 99.0 /100 | #84 | Exceptional 11.1% |
| Immigrants | Belarus | 98.9 /100 | #85 | Exceptional 11.1% |
| Immigrants | Russia | 98.9 /100 | #86 | Exceptional 11.1% |
| Palestinians | 98.9 /100 | #87 | Exceptional 11.1% |
| Immigrants | Romania | 98.5 /100 | #88 | Exceptional 11.2% |
| Immigrants | South Africa | 98.2 /100 | #89 | Exceptional 11.2% |
| Immigrants | Brazil | 98.1 /100 | #90 | Exceptional 11.2% |
| Immigrants | Western Asia | 98.1 /100 | #91 | Exceptional 11.2% |
| Ecuadorians | 98.0 /100 | #92 | Exceptional 11.2% |
| Immigrants | Ecuador | 98.0 /100 | #93 | Exceptional 11.2% |
| Immigrants | Morocco | 97.8 /100 | #94 | Exceptional 11.2% |
| Eastern Europeans | 97.8 /100 | #95 | Exceptional 11.2% |
| Immigrants | Zimbabwe | 97.7 /100 | #96 | Exceptional 11.2% |
Demographics Similar to Vietnamese by Disability
In terms of disability, the demographic groups most similar to Vietnamese are Immigrants from Saudi Arabia (10.9%, a difference of 0.0%), Peruvian (10.9%, a difference of 0.010%), Soviet Union (10.9%, a difference of 0.060%), South American (10.9%, a difference of 0.070%), and Immigrants from Spain (10.9%, a difference of 0.090%).
| Demographics | Rating | Rank | Disability |
| Immigrants | Nepal | 99.9 /100 | #42 | Exceptional 10.8% |
| Israelis | 99.9 /100 | #43 | Exceptional 10.8% |
| Immigrants | Japan | 99.9 /100 | #44 | Exceptional 10.8% |
| Immigrants | Peru | 99.9 /100 | #45 | Exceptional 10.8% |
| Tongans | 99.9 /100 | #46 | Exceptional 10.8% |
| Taiwanese | 99.9 /100 | #47 | Exceptional 10.8% |
| Soviet Union | 99.9 /100 | #48 | Exceptional 10.9% |
| Vietnamese | 99.9 /100 | #49 | Exceptional 10.9% |
| Immigrants | Saudi Arabia | 99.9 /100 | #50 | Exceptional 10.9% |
| Peruvians | 99.8 /100 | #51 | Exceptional 10.9% |
| South Americans | 99.8 /100 | #52 | Exceptional 10.9% |
| Immigrants | Spain | 99.8 /100 | #53 | Exceptional 10.9% |
| Jordanians | 99.8 /100 | #54 | Exceptional 10.9% |
| Immigrants | El Salvador | 99.8 /100 | #55 | Exceptional 10.9% |
| Immigrants | Lithuania | 99.8 /100 | #56 | Exceptional 10.9% |