Immigrants from South Africa vs Immigrants from Nigeria Hearing Disability
COMPARE
Immigrants from South Africa
Immigrants from Nigeria
Hearing Disability
Hearing Disability Comparison
Immigrants from South Africa
Immigrants from Nigeria
3.1%
HEARING DISABILITY
31.1/ 100
METRIC RATING
190th/ 347
METRIC RANK
2.6%
HEARING DISABILITY
99.8/ 100
METRIC RATING
23rd/ 347
METRIC RANK
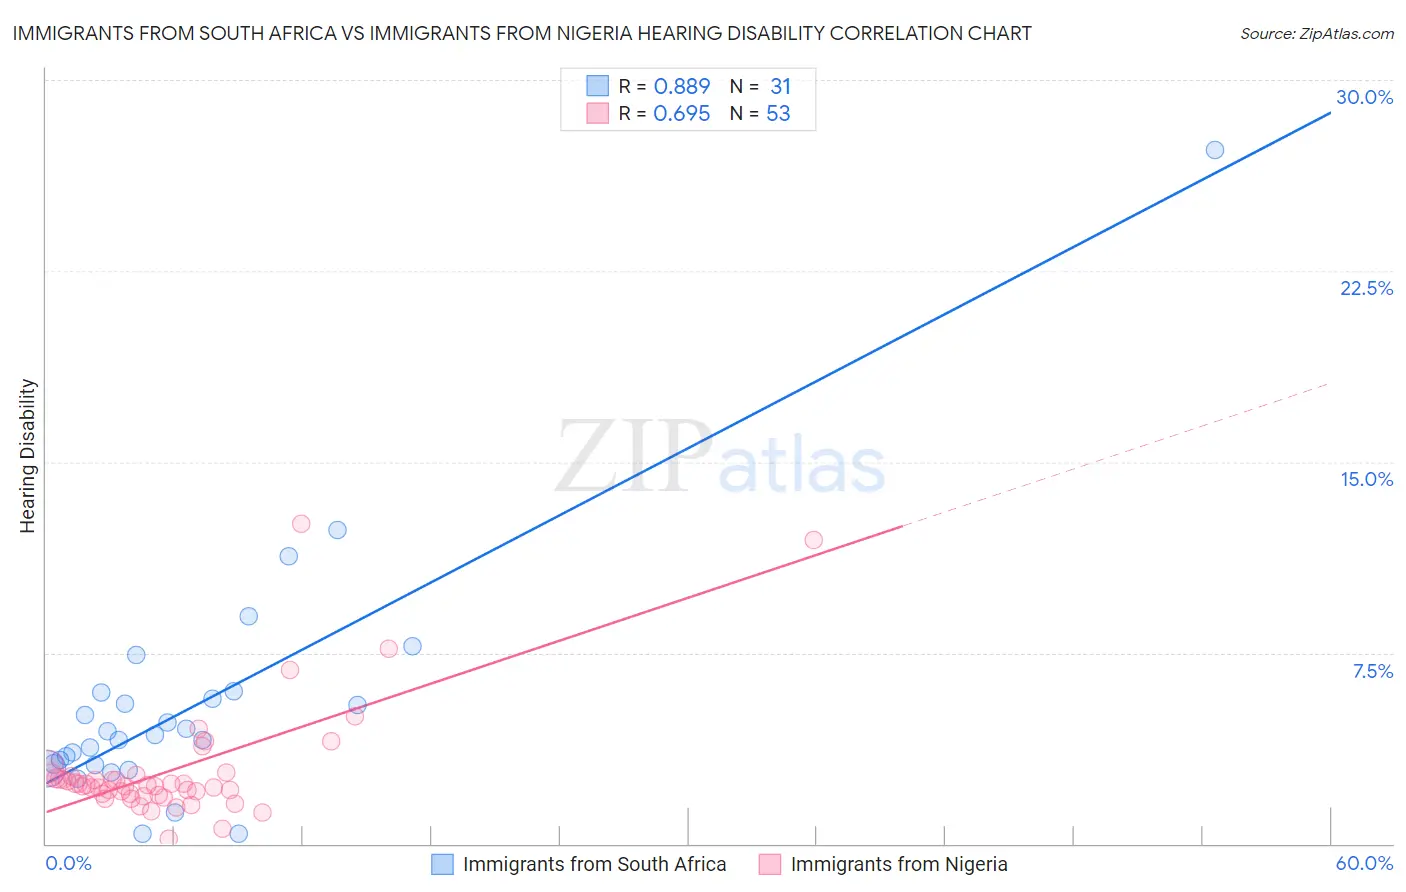
Immigrants from South Africa vs Immigrants from Nigeria Hearing Disability Correlation Chart
The statistical analysis conducted on geographies consisting of 233,290,036 people shows a very strong positive correlation between the proportion of Immigrants from South Africa and percentage of population with hearing disability in the United States with a correlation coefficient (R) of 0.889 and weighted average of 3.1%. Similarly, the statistical analysis conducted on geographies consisting of 283,406,904 people shows a significant positive correlation between the proportion of Immigrants from Nigeria and percentage of population with hearing disability in the United States with a correlation coefficient (R) of 0.695 and weighted average of 2.6%, a difference of 19.0%.
Hearing Disability Correlation Summary
| Measurement | Immigrants from South Africa | Immigrants from Nigeria |
| Minimum | 0.40% | 0.19% |
| Maximum | 27.3% | 12.6% |
| Range | 26.9% | 12.4% |
| Mean | 5.4% | 2.9% |
| Median | 4.3% | 2.3% |
| Interquartile 25% (IQ1) | 3.1% | 1.9% |
| Interquartile 75% (IQ3) | 6.0% | 2.7% |
| Interquartile Range (IQR) | 2.9% | 0.75% |
| Standard Deviation (Sample) | 4.9% | 2.3% |
| Standard Deviation (Population) | 4.8% | 2.2% |
Similar Demographics by Hearing Disability
Demographics Similar to Immigrants from South Africa by Hearing Disability
In terms of hearing disability, the demographic groups most similar to Immigrants from South Africa are African (3.0%, a difference of 0.19%), Immigrants from Switzerland (3.1%, a difference of 0.25%), Black/African American (3.0%, a difference of 0.38%), Mexican American Indian (3.0%, a difference of 0.38%), and Korean (3.1%, a difference of 0.38%).
| Demographics | Rating | Rank | Hearing Disability |
| Bulgarians | 39.7 /100 | #183 | Fair 3.0% |
| Immigrants | Ireland | 37.4 /100 | #184 | Fair 3.0% |
| Immigrants | Southern Europe | 35.3 /100 | #185 | Fair 3.0% |
| Immigrants | Mexico | 34.9 /100 | #186 | Fair 3.0% |
| Blacks/African Americans | 34.7 /100 | #187 | Fair 3.0% |
| Mexican American Indians | 34.7 /100 | #188 | Fair 3.0% |
| Africans | 32.9 /100 | #189 | Fair 3.0% |
| Immigrants | South Africa | 31.1 /100 | #190 | Fair 3.1% |
| Immigrants | Switzerland | 28.8 /100 | #191 | Fair 3.1% |
| Koreans | 27.6 /100 | #192 | Fair 3.1% |
| Macedonians | 27.0 /100 | #193 | Fair 3.1% |
| South Africans | 24.5 /100 | #194 | Fair 3.1% |
| Spanish American Indians | 24.1 /100 | #195 | Fair 3.1% |
| Immigrants | Europe | 22.9 /100 | #196 | Fair 3.1% |
| Immigrants | Bosnia and Herzegovina | 20.6 /100 | #197 | Fair 3.1% |
Demographics Similar to Immigrants from Nigeria by Hearing Disability
In terms of hearing disability, the demographic groups most similar to Immigrants from Nigeria are Immigrants from Ghana (2.6%, a difference of 0.25%), Immigrants from Sierra Leone (2.6%, a difference of 0.50%), Ghanaian (2.5%, a difference of 0.54%), Immigrants from Bolivia (2.5%, a difference of 0.61%), and Thai (2.5%, a difference of 0.65%).
| Demographics | Rating | Rank | Hearing Disability |
| Immigrants | West Indies | 99.9 /100 | #16 | Exceptional 2.5% |
| Immigrants | India | 99.9 /100 | #17 | Exceptional 2.5% |
| Dominicans | 99.8 /100 | #18 | Exceptional 2.5% |
| Thais | 99.8 /100 | #19 | Exceptional 2.5% |
| Immigrants | Bolivia | 99.8 /100 | #20 | Exceptional 2.5% |
| Ghanaians | 99.8 /100 | #21 | Exceptional 2.5% |
| Immigrants | Sierra Leone | 99.8 /100 | #22 | Exceptional 2.6% |
| Immigrants | Nigeria | 99.8 /100 | #23 | Exceptional 2.6% |
| Immigrants | Ghana | 99.8 /100 | #24 | Exceptional 2.6% |
| Immigrants | El Salvador | 99.7 /100 | #25 | Exceptional 2.6% |
| Immigrants | Senegal | 99.7 /100 | #26 | Exceptional 2.6% |
| Immigrants | South Central Asia | 99.7 /100 | #27 | Exceptional 2.6% |
| Immigrants | Haiti | 99.7 /100 | #28 | Exceptional 2.6% |
| Bolivians | 99.7 /100 | #29 | Exceptional 2.6% |
| Immigrants | Caribbean | 99.7 /100 | #30 | Exceptional 2.6% |