Immigrants from Somalia vs Egyptian Female Disability
COMPARE
Immigrants from Somalia
Egyptian
Female Disability
Female Disability Comparison
Immigrants from Somalia
Egyptians
12.5%
FEMALE DISABILITY
5.9/ 100
METRIC RATING
232nd/ 347
METRIC RANK
11.1%
FEMALE DISABILITY
100.0/ 100
METRIC RATING
28th/ 347
METRIC RANK
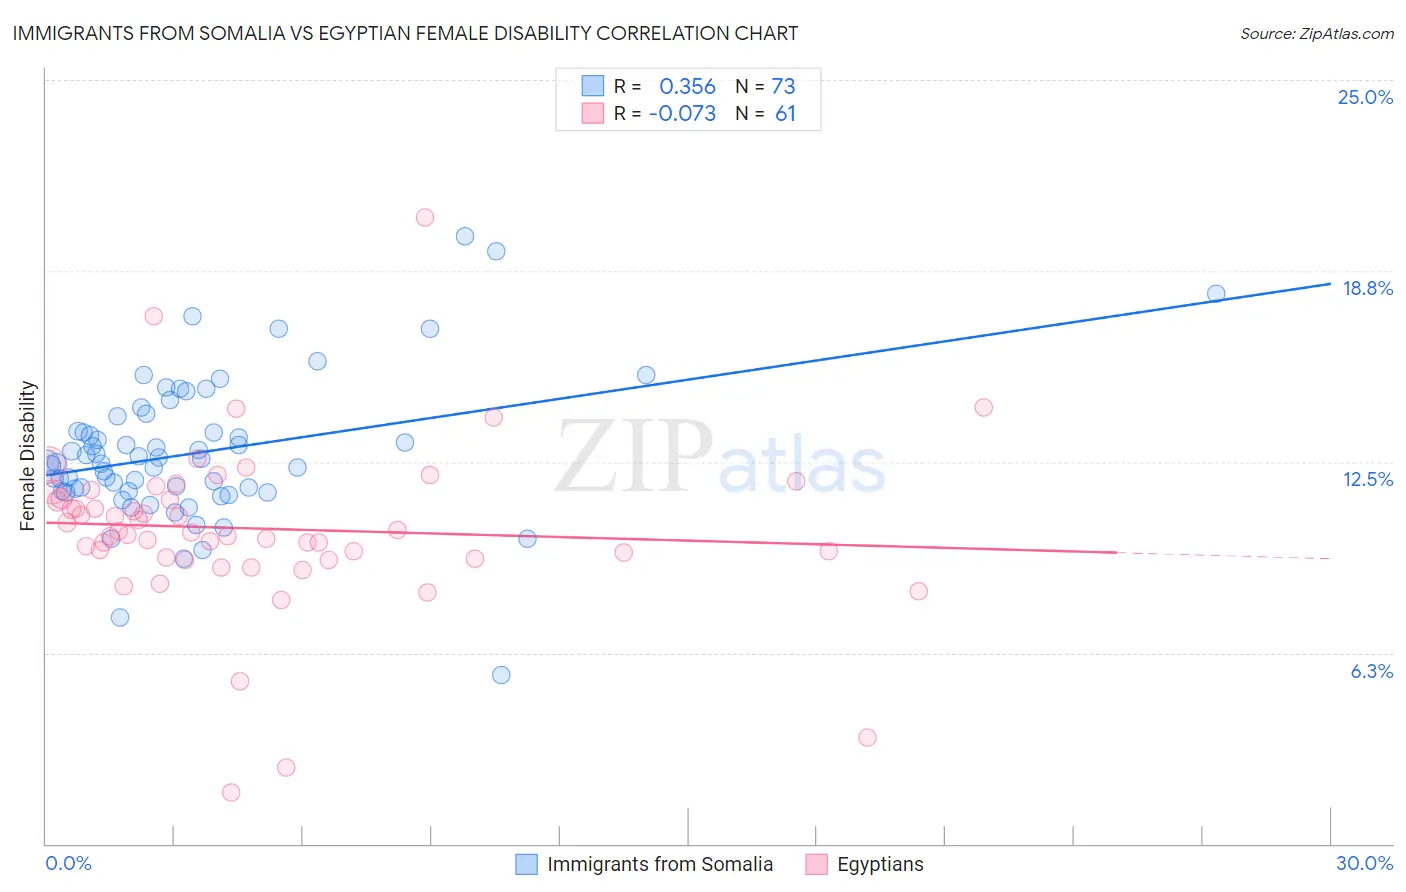
Immigrants from Somalia vs Egyptian Female Disability Correlation Chart
The statistical analysis conducted on geographies consisting of 92,095,400 people shows a mild positive correlation between the proportion of Immigrants from Somalia and percentage of females with a disability in the United States with a correlation coefficient (R) of 0.356 and weighted average of 12.5%. Similarly, the statistical analysis conducted on geographies consisting of 276,904,353 people shows a slight negative correlation between the proportion of Egyptians and percentage of females with a disability in the United States with a correlation coefficient (R) of -0.073 and weighted average of 11.1%, a difference of 12.8%.
Female Disability Correlation Summary
| Measurement | Immigrants from Somalia | Egyptian |
| Minimum | 5.5% | 1.7% |
| Maximum | 19.9% | 20.5% |
| Range | 14.4% | 18.8% |
| Mean | 12.8% | 10.3% |
| Median | 12.5% | 10.2% |
| Interquartile 25% (IQ1) | 11.6% | 9.3% |
| Interquartile 75% (IQ3) | 13.8% | 11.4% |
| Interquartile Range (IQR) | 2.2% | 2.1% |
| Standard Deviation (Sample) | 2.4% | 2.8% |
| Standard Deviation (Population) | 2.3% | 2.8% |
Similar Demographics by Female Disability
Demographics Similar to Immigrants from Somalia by Female Disability
In terms of female disability, the demographic groups most similar to Immigrants from Somalia are Belgian (12.5%, a difference of 0.090%), Immigrants from Iraq (12.5%, a difference of 0.10%), Scandinavian (12.5%, a difference of 0.11%), Immigrants from Belize (12.5%, a difference of 0.16%), and Malaysian (12.5%, a difference of 0.17%).
| Demographics | Rating | Rank | Female Disability |
| Poles | 8.4 /100 | #225 | Tragic 12.5% |
| Hispanics or Latinos | 8.0 /100 | #226 | Tragic 12.5% |
| Assyrians/Chaldeans/Syriacs | 8.0 /100 | #227 | Tragic 12.5% |
| Immigrants | Cambodia | 7.8 /100 | #228 | Tragic 12.5% |
| Hungarians | 7.2 /100 | #229 | Tragic 12.5% |
| Immigrants | Belize | 7.0 /100 | #230 | Tragic 12.5% |
| Belgians | 6.5 /100 | #231 | Tragic 12.5% |
| Immigrants | Somalia | 5.9 /100 | #232 | Tragic 12.5% |
| Immigrants | Iraq | 5.3 /100 | #233 | Tragic 12.5% |
| Scandinavians | 5.3 /100 | #234 | Tragic 12.5% |
| Malaysians | 5.0 /100 | #235 | Tragic 12.5% |
| Immigrants | West Indies | 4.4 /100 | #236 | Tragic 12.6% |
| Slavs | 3.8 /100 | #237 | Tragic 12.6% |
| Yugoslavians | 3.7 /100 | #238 | Tragic 12.6% |
| Barbadians | 3.6 /100 | #239 | Tragic 12.6% |
Demographics Similar to Egyptians by Female Disability
In terms of female disability, the demographic groups most similar to Egyptians are Immigrants from Malaysia (11.1%, a difference of 0.060%), Turkish (11.1%, a difference of 0.070%), Immigrants from Kuwait (11.1%, a difference of 0.17%), Immigrants from Turkey (11.1%, a difference of 0.27%), and Immigrants from Australia (11.1%, a difference of 0.33%).
| Demographics | Rating | Rank | Female Disability |
| Asians | 100.0 /100 | #21 | Exceptional 10.9% |
| Immigrants | Sri Lanka | 100.0 /100 | #22 | Exceptional 10.9% |
| Venezuelans | 100.0 /100 | #23 | Exceptional 11.0% |
| Immigrants | Argentina | 100.0 /100 | #24 | Exceptional 11.0% |
| Immigrants | Asia | 100.0 /100 | #25 | Exceptional 11.0% |
| Argentineans | 100.0 /100 | #26 | Exceptional 11.0% |
| Immigrants | Turkey | 100.0 /100 | #27 | Exceptional 11.1% |
| Egyptians | 100.0 /100 | #28 | Exceptional 11.1% |
| Immigrants | Malaysia | 100.0 /100 | #29 | Exceptional 11.1% |
| Turks | 100.0 /100 | #30 | Exceptional 11.1% |
| Immigrants | Kuwait | 100.0 /100 | #31 | Exceptional 11.1% |
| Immigrants | Australia | 100.0 /100 | #32 | Exceptional 11.1% |
| Immigrants | Egypt | 100.0 /100 | #33 | Exceptional 11.1% |
| Immigrants | Indonesia | 100.0 /100 | #34 | Exceptional 11.2% |
| Immigrants | Japan | 100.0 /100 | #35 | Exceptional 11.2% |