Immigrants from Moldova vs Finnish Self-Care Disability
COMPARE
Immigrants from Moldova
Finnish
Self-Care Disability
Self-Care Disability Comparison
Immigrants from Moldova
Finns
2.6%
SELF-CARE DISABILITY
4.0/ 100
METRIC RATING
219th/ 347
METRIC RANK
2.4%
SELF-CARE DISABILITY
67.0/ 100
METRIC RATING
160th/ 347
METRIC RANK
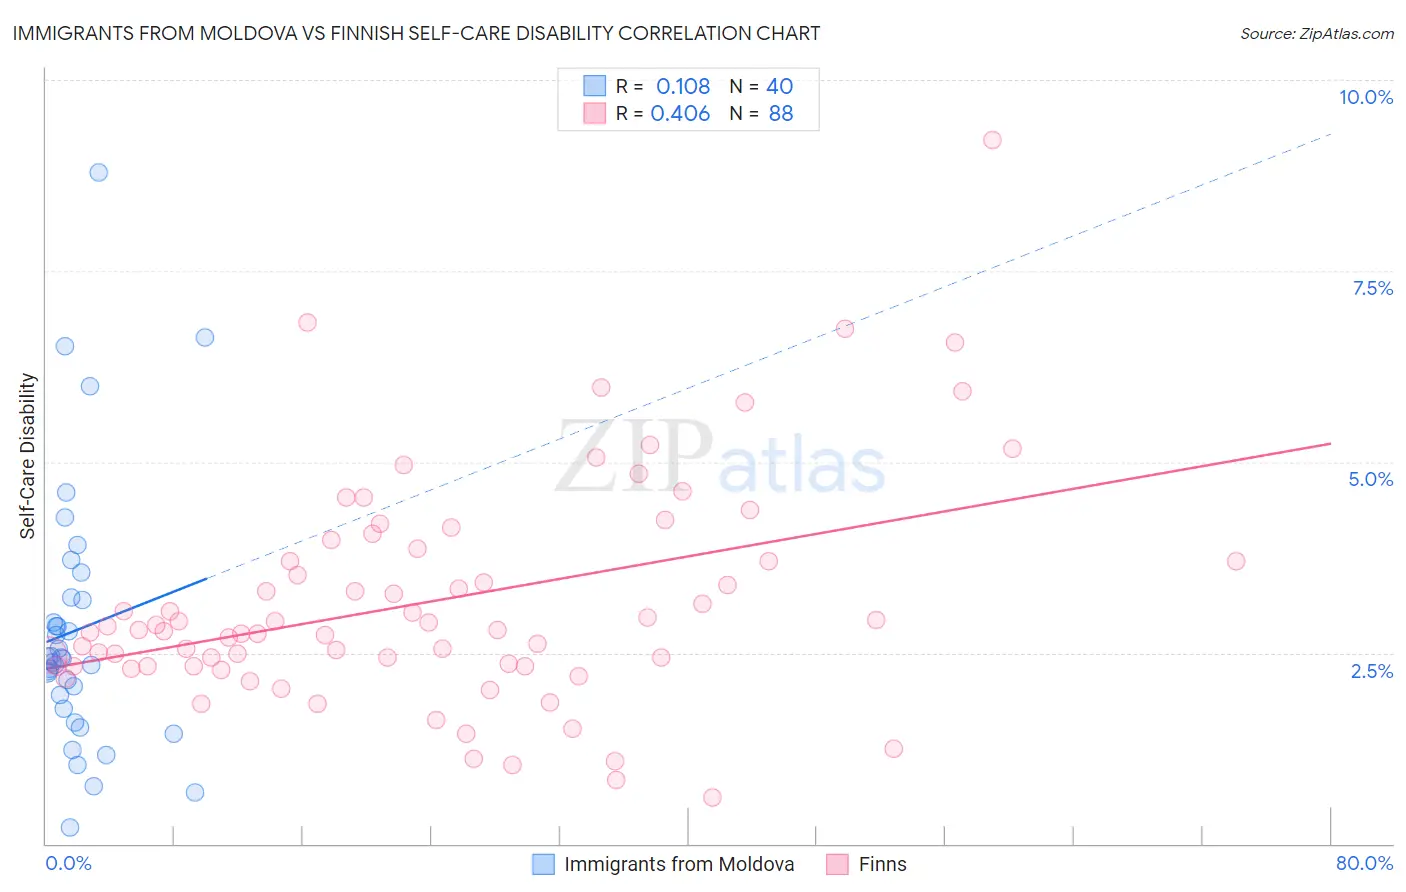
Immigrants from Moldova vs Finnish Self-Care Disability Correlation Chart
The statistical analysis conducted on geographies consisting of 124,345,596 people shows a poor positive correlation between the proportion of Immigrants from Moldova and percentage of population with self-care disability in the United States with a correlation coefficient (R) of 0.108 and weighted average of 2.6%. Similarly, the statistical analysis conducted on geographies consisting of 404,111,559 people shows a moderate positive correlation between the proportion of Finns and percentage of population with self-care disability in the United States with a correlation coefficient (R) of 0.406 and weighted average of 2.4%, a difference of 4.7%.
Self-Care Disability Correlation Summary
| Measurement | Immigrants from Moldova | Finnish |
| Minimum | 0.22% | 0.60% |
| Maximum | 8.8% | 9.2% |
| Range | 8.6% | 8.6% |
| Mean | 2.8% | 3.2% |
| Median | 2.4% | 2.8% |
| Interquartile 25% (IQ1) | 1.9% | 2.3% |
| Interquartile 75% (IQ3) | 3.2% | 3.8% |
| Interquartile Range (IQR) | 1.4% | 1.5% |
| Standard Deviation (Sample) | 1.7% | 1.5% |
| Standard Deviation (Population) | 1.7% | 1.5% |
Similar Demographics by Self-Care Disability
Demographics Similar to Immigrants from Moldova by Self-Care Disability
In terms of self-care disability, the demographic groups most similar to Immigrants from Moldova are Subsaharan African (2.6%, a difference of 0.010%), Scotch-Irish (2.6%, a difference of 0.030%), Honduran (2.6%, a difference of 0.050%), Spaniard (2.6%, a difference of 0.060%), and French Canadian (2.6%, a difference of 0.060%).
| Demographics | Rating | Rank | Self-Care Disability |
| Samoans | 5.1 /100 | #212 | Tragic 2.6% |
| Ecuadorians | 4.7 /100 | #213 | Tragic 2.6% |
| Immigrants | Honduras | 4.7 /100 | #214 | Tragic 2.6% |
| Immigrants | Thailand | 4.5 /100 | #215 | Tragic 2.6% |
| Whites/Caucasians | 4.4 /100 | #216 | Tragic 2.6% |
| Celtics | 4.4 /100 | #217 | Tragic 2.6% |
| Scotch-Irish | 4.1 /100 | #218 | Tragic 2.6% |
| Immigrants | Moldova | 4.0 /100 | #219 | Tragic 2.6% |
| Sub-Saharan Africans | 4.0 /100 | #220 | Tragic 2.6% |
| Hondurans | 3.8 /100 | #221 | Tragic 2.6% |
| Spaniards | 3.8 /100 | #222 | Tragic 2.6% |
| French Canadians | 3.8 /100 | #223 | Tragic 2.6% |
| Osage | 3.6 /100 | #224 | Tragic 2.6% |
| Iraqis | 3.2 /100 | #225 | Tragic 2.6% |
| Chinese | 2.9 /100 | #226 | Tragic 2.6% |
Demographics Similar to Finns by Self-Care Disability
In terms of self-care disability, the demographic groups most similar to Finns are Lebanese (2.4%, a difference of 0.030%), Immigrants from Italy (2.4%, a difference of 0.080%), Immigrants from Western Europe (2.4%, a difference of 0.090%), Immigrants from Europe (2.4%, a difference of 0.14%), and Somali (2.5%, a difference of 0.17%).
| Demographics | Rating | Rank | Self-Care Disability |
| Immigrants | England | 73.5 /100 | #153 | Good 2.4% |
| Italians | 72.2 /100 | #154 | Good 2.4% |
| Pakistanis | 71.4 /100 | #155 | Good 2.4% |
| Nigerians | 70.6 /100 | #156 | Good 2.4% |
| Immigrants | Europe | 69.6 /100 | #157 | Good 2.4% |
| Immigrants | Western Europe | 68.6 /100 | #158 | Good 2.4% |
| Immigrants | Italy | 68.5 /100 | #159 | Good 2.4% |
| Finns | 67.0 /100 | #160 | Good 2.4% |
| Lebanese | 66.5 /100 | #161 | Good 2.4% |
| Somalis | 63.7 /100 | #162 | Good 2.5% |
| German Russians | 62.7 /100 | #163 | Good 2.5% |
| Immigrants | Vietnam | 59.3 /100 | #164 | Average 2.5% |
| Syrians | 59.0 /100 | #165 | Average 2.5% |
| Canadians | 58.8 /100 | #166 | Average 2.5% |
| Immigrants | Greece | 57.3 /100 | #167 | Average 2.5% |