Immigrants from Liberia vs Immigrants from Canada Male Disability
COMPARE
Immigrants from Liberia
Immigrants from Canada
Male Disability
Male Disability Comparison
Immigrants from Liberia
Immigrants from Canada
11.9%
MALE DISABILITY
1.0/ 100
METRIC RATING
245th/ 347
METRIC RANK
11.9%
MALE DISABILITY
1.6/ 100
METRIC RATING
234th/ 347
METRIC RANK
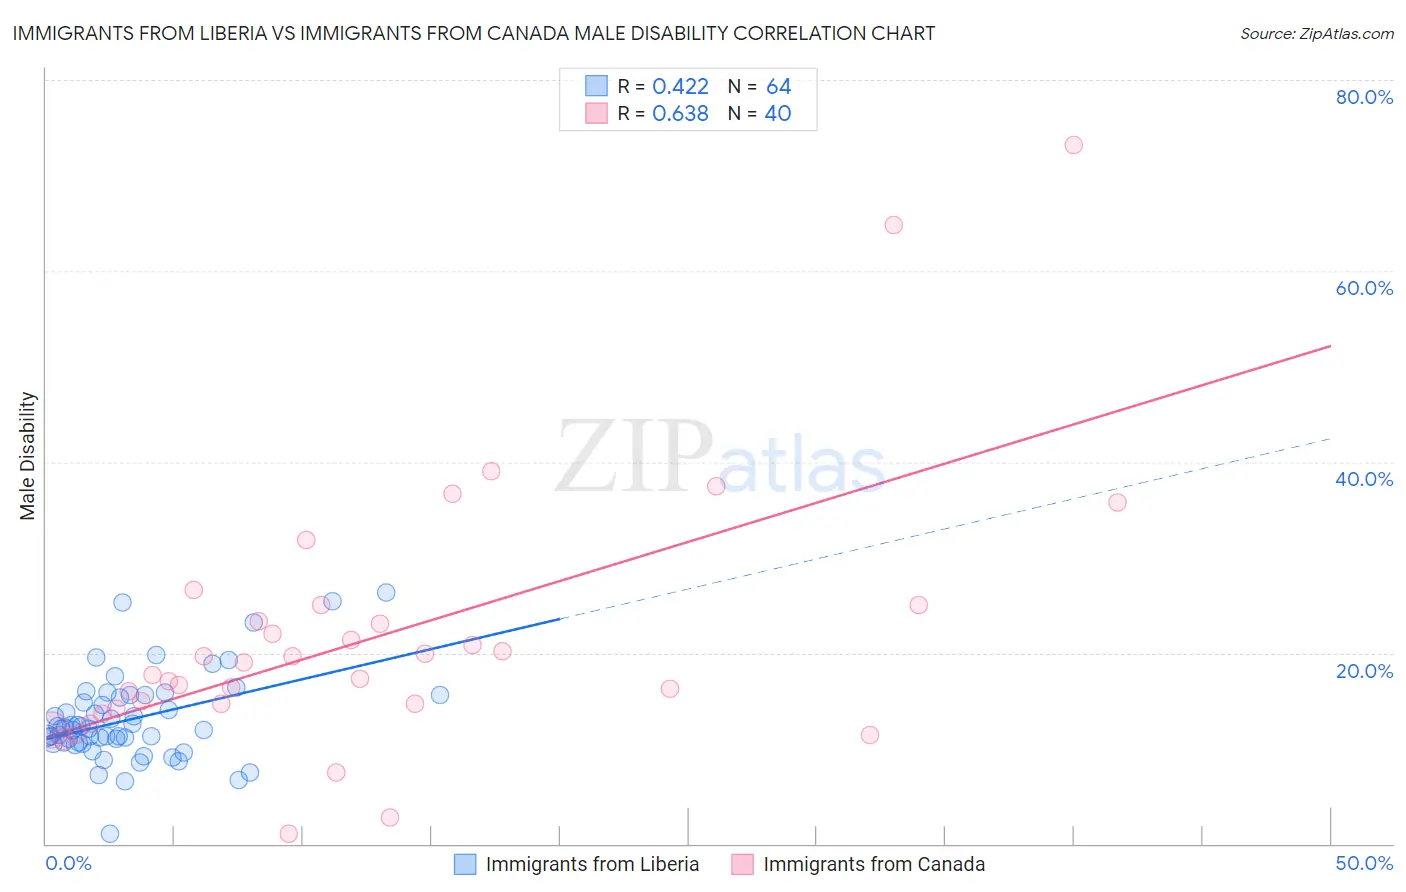
Immigrants from Liberia vs Immigrants from Canada Male Disability Correlation Chart
The statistical analysis conducted on geographies consisting of 135,258,288 people shows a moderate positive correlation between the proportion of Immigrants from Liberia and percentage of males with a disability in the United States with a correlation coefficient (R) of 0.422 and weighted average of 11.9%. Similarly, the statistical analysis conducted on geographies consisting of 459,334,704 people shows a significant positive correlation between the proportion of Immigrants from Canada and percentage of males with a disability in the United States with a correlation coefficient (R) of 0.638 and weighted average of 11.9%, a difference of 0.67%.
Male Disability Correlation Summary
| Measurement | Immigrants from Liberia | Immigrants from Canada |
| Minimum | 1.1% | 1.0% |
| Maximum | 26.3% | 73.2% |
| Range | 25.2% | 72.2% |
| Mean | 13.0% | 21.6% |
| Median | 12.1% | 18.4% |
| Interquartile 25% (IQ1) | 10.6% | 14.4% |
| Interquartile 75% (IQ3) | 15.5% | 24.1% |
| Interquartile Range (IQR) | 4.9% | 9.8% |
| Standard Deviation (Sample) | 4.6% | 14.0% |
| Standard Deviation (Population) | 4.5% | 13.8% |
Demographics Similar to Immigrants from Liberia and Immigrants from Canada by Male Disability
In terms of male disability, the demographic groups most similar to Immigrants from Liberia are Immigrants from Laos (11.9%, a difference of 0.0%), Danish (11.9%, a difference of 0.030%), Samoan (11.9%, a difference of 0.12%), Northern European (11.9%, a difference of 0.15%), and Bahamian (11.9%, a difference of 0.16%). Similarly, the demographic groups most similar to Immigrants from Canada are Mexican (11.8%, a difference of 0.070%), Malaysian (11.8%, a difference of 0.11%), Immigrants from North America (11.9%, a difference of 0.13%), Dominican (11.8%, a difference of 0.18%), and U.S. Virgin Islander (11.9%, a difference of 0.26%).
| Demographics | Rating | Rank | Male Disability |
| Bermudans | 2.3 /100 | #229 | Tragic 11.8% |
| Croatians | 2.1 /100 | #230 | Tragic 11.8% |
| Dominicans | 1.8 /100 | #231 | Tragic 11.8% |
| Malaysians | 1.8 /100 | #232 | Tragic 11.8% |
| Mexicans | 1.7 /100 | #233 | Tragic 11.8% |
| Immigrants | Canada | 1.6 /100 | #234 | Tragic 11.9% |
| Immigrants | North America | 1.5 /100 | #235 | Tragic 11.9% |
| U.S. Virgin Islanders | 1.3 /100 | #236 | Tragic 11.9% |
| Carpatho Rusyns | 1.3 /100 | #237 | Tragic 11.9% |
| Yugoslavians | 1.2 /100 | #238 | Tragic 11.9% |
| Italians | 1.2 /100 | #239 | Tragic 11.9% |
| Czechs | 1.1 /100 | #240 | Tragic 11.9% |
| Bahamians | 1.1 /100 | #241 | Tragic 11.9% |
| Northern Europeans | 1.1 /100 | #242 | Tragic 11.9% |
| Samoans | 1.1 /100 | #243 | Tragic 11.9% |
| Immigrants | Laos | 1.0 /100 | #244 | Tragic 11.9% |
| Immigrants | Liberia | 1.0 /100 | #245 | Tragic 11.9% |
| Danes | 0.9 /100 | #246 | Tragic 11.9% |
| Hungarians | 0.8 /100 | #247 | Tragic 12.0% |
| Poles | 0.7 /100 | #248 | Tragic 12.0% |
| Immigrants | Yemen | 0.5 /100 | #249 | Tragic 12.0% |