Cherokee vs Immigrants from Canada Male Disability
COMPARE
Cherokee
Immigrants from Canada
Male Disability
Male Disability Comparison
Cherokee
Immigrants from Canada
14.8%
MALE DISABILITY
0.0/ 100
METRIC RATING
334th/ 347
METRIC RANK
11.9%
MALE DISABILITY
1.6/ 100
METRIC RATING
234th/ 347
METRIC RANK
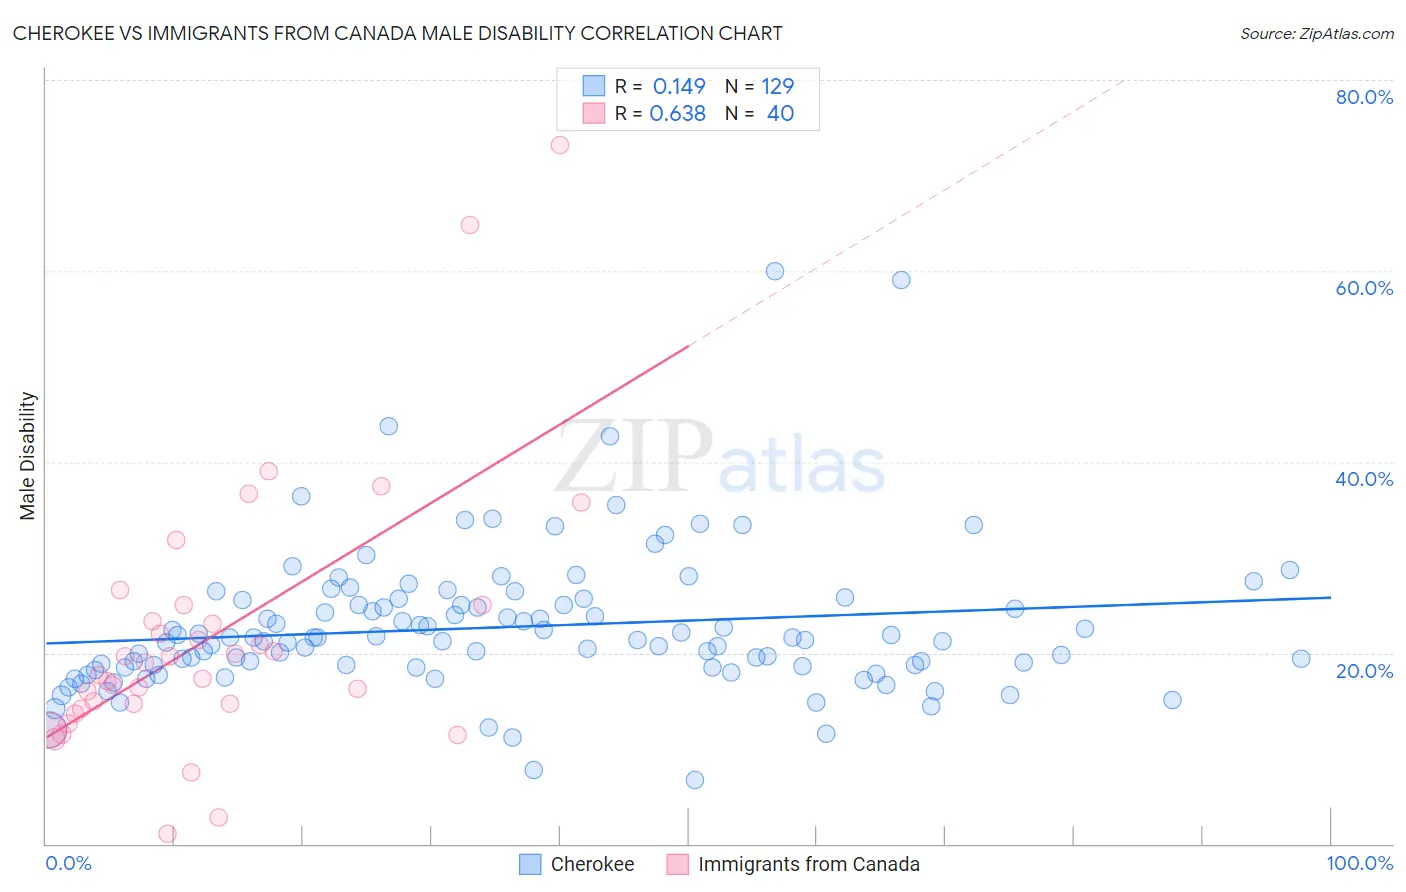
Cherokee vs Immigrants from Canada Male Disability Correlation Chart
The statistical analysis conducted on geographies consisting of 493,554,719 people shows a poor positive correlation between the proportion of Cherokee and percentage of males with a disability in the United States with a correlation coefficient (R) of 0.149 and weighted average of 14.8%. Similarly, the statistical analysis conducted on geographies consisting of 459,334,704 people shows a significant positive correlation between the proportion of Immigrants from Canada and percentage of males with a disability in the United States with a correlation coefficient (R) of 0.638 and weighted average of 11.9%, a difference of 25.2%.
Male Disability Correlation Summary
| Measurement | Cherokee | Immigrants from Canada |
| Minimum | 6.7% | 1.0% |
| Maximum | 60.0% | 73.2% |
| Range | 53.3% | 72.2% |
| Mean | 22.7% | 21.6% |
| Median | 21.4% | 18.4% |
| Interquartile 25% (IQ1) | 18.5% | 14.4% |
| Interquartile 75% (IQ3) | 25.3% | 24.1% |
| Interquartile Range (IQR) | 6.7% | 9.8% |
| Standard Deviation (Sample) | 7.6% | 14.0% |
| Standard Deviation (Population) | 7.6% | 13.8% |
Similar Demographics by Male Disability
Demographics Similar to Cherokee by Male Disability
In terms of male disability, the demographic groups most similar to Cherokee are Dutch West Indian (14.8%, a difference of 0.020%), Alaskan Athabascan (14.9%, a difference of 0.49%), Yuman (14.7%, a difference of 0.68%), Seminole (14.7%, a difference of 0.78%), and Menominee (15.0%, a difference of 1.0%).
| Demographics | Rating | Rank | Male Disability |
| Potawatomi | 0.0 /100 | #327 | Tragic 14.2% |
| Chippewa | 0.0 /100 | #328 | Tragic 14.3% |
| Cajuns | 0.0 /100 | #329 | Tragic 14.4% |
| Navajo | 0.0 /100 | #330 | Tragic 14.4% |
| Tohono O'odham | 0.0 /100 | #331 | Tragic 14.6% |
| Seminole | 0.0 /100 | #332 | Tragic 14.7% |
| Yuman | 0.0 /100 | #333 | Tragic 14.7% |
| Cherokee | 0.0 /100 | #334 | Tragic 14.8% |
| Dutch West Indians | 0.0 /100 | #335 | Tragic 14.8% |
| Alaskan Athabascans | 0.0 /100 | #336 | Tragic 14.9% |
| Menominee | 0.0 /100 | #337 | Tragic 15.0% |
| Pueblo | 0.0 /100 | #338 | Tragic 15.0% |
| Chickasaw | 0.0 /100 | #339 | Tragic 15.1% |
| Lumbee | 0.0 /100 | #340 | Tragic 15.2% |
| Choctaw | 0.0 /100 | #341 | Tragic 15.4% |
Demographics Similar to Immigrants from Canada by Male Disability
In terms of male disability, the demographic groups most similar to Immigrants from Canada are Mexican (11.8%, a difference of 0.070%), Malaysian (11.8%, a difference of 0.11%), Immigrants from North America (11.9%, a difference of 0.13%), Dominican (11.8%, a difference of 0.18%), and U.S. Virgin Islander (11.9%, a difference of 0.26%).
| Demographics | Rating | Rank | Male Disability |
| Austrians | 2.5 /100 | #227 | Tragic 11.8% |
| Hispanics or Latinos | 2.3 /100 | #228 | Tragic 11.8% |
| Bermudans | 2.3 /100 | #229 | Tragic 11.8% |
| Croatians | 2.1 /100 | #230 | Tragic 11.8% |
| Dominicans | 1.8 /100 | #231 | Tragic 11.8% |
| Malaysians | 1.8 /100 | #232 | Tragic 11.8% |
| Mexicans | 1.7 /100 | #233 | Tragic 11.8% |
| Immigrants | Canada | 1.6 /100 | #234 | Tragic 11.9% |
| Immigrants | North America | 1.5 /100 | #235 | Tragic 11.9% |
| U.S. Virgin Islanders | 1.3 /100 | #236 | Tragic 11.9% |
| Carpatho Rusyns | 1.3 /100 | #237 | Tragic 11.9% |
| Yugoslavians | 1.2 /100 | #238 | Tragic 11.9% |
| Italians | 1.2 /100 | #239 | Tragic 11.9% |
| Czechs | 1.1 /100 | #240 | Tragic 11.9% |
| Bahamians | 1.1 /100 | #241 | Tragic 11.9% |