Immigrants from Kazakhstan vs Barbadian Ambulatory Disability
COMPARE
Immigrants from Kazakhstan
Barbadian
Ambulatory Disability
Ambulatory Disability Comparison
Immigrants from Kazakhstan
Barbadians
5.9%
AMBULATORY DISABILITY
89.7/ 100
METRIC RATING
130th/ 347
METRIC RANK
6.8%
AMBULATORY DISABILITY
0.0/ 100
METRIC RATING
282nd/ 347
METRIC RANK
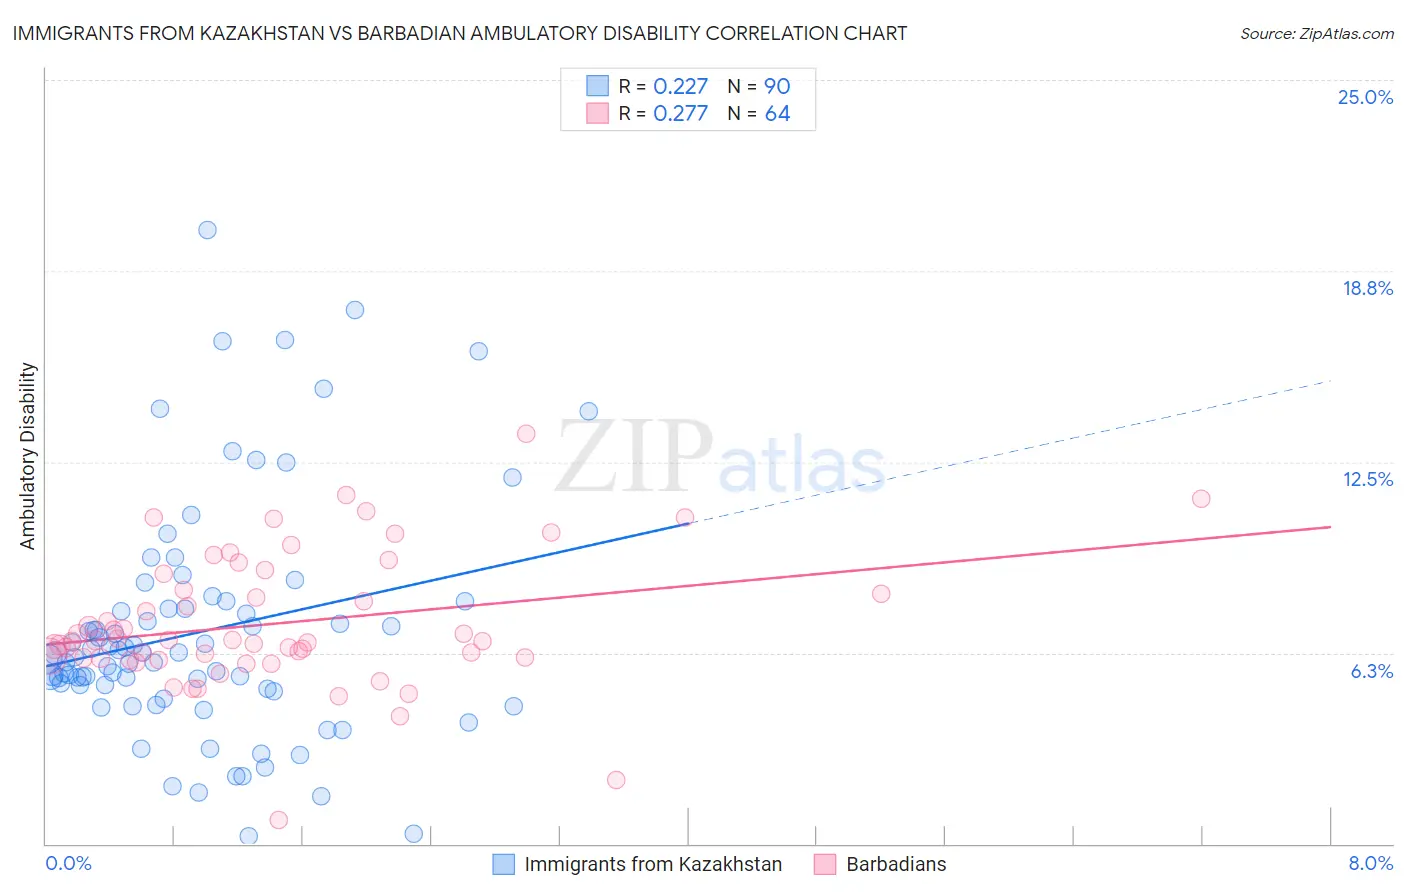
Immigrants from Kazakhstan vs Barbadian Ambulatory Disability Correlation Chart
The statistical analysis conducted on geographies consisting of 124,443,278 people shows a weak positive correlation between the proportion of Immigrants from Kazakhstan and percentage of population with ambulatory disability in the United States with a correlation coefficient (R) of 0.227 and weighted average of 5.9%. Similarly, the statistical analysis conducted on geographies consisting of 141,286,079 people shows a weak positive correlation between the proportion of Barbadians and percentage of population with ambulatory disability in the United States with a correlation coefficient (R) of 0.277 and weighted average of 6.8%, a difference of 13.9%.
Ambulatory Disability Correlation Summary
| Measurement | Immigrants from Kazakhstan | Barbadian |
| Minimum | 0.25% | 0.77% |
| Maximum | 20.1% | 13.4% |
| Range | 19.9% | 12.7% |
| Mean | 6.9% | 7.2% |
| Median | 6.2% | 6.7% |
| Interquartile 25% (IQ1) | 5.1% | 6.1% |
| Interquartile 75% (IQ3) | 7.7% | 8.6% |
| Interquartile Range (IQR) | 2.6% | 2.5% |
| Standard Deviation (Sample) | 3.8% | 2.2% |
| Standard Deviation (Population) | 3.8% | 2.2% |
Similar Demographics by Ambulatory Disability
Demographics Similar to Immigrants from Kazakhstan by Ambulatory Disability
In terms of ambulatory disability, the demographic groups most similar to Immigrants from Kazakhstan are Immigrants from Costa Rica (5.9%, a difference of 0.030%), Immigrants from Norway (5.9%, a difference of 0.11%), Immigrants from Western Asia (5.9%, a difference of 0.14%), Immigrants from Nigeria (5.9%, a difference of 0.18%), and Immigrants from Europe (6.0%, a difference of 0.27%).
| Demographics | Rating | Rank | Ambulatory Disability |
| Immigrants | Russia | 92.4 /100 | #123 | Exceptional 5.9% |
| Immigrants | Middle Africa | 92.2 /100 | #124 | Exceptional 5.9% |
| Koreans | 91.6 /100 | #125 | Exceptional 5.9% |
| Arabs | 91.5 /100 | #126 | Exceptional 5.9% |
| Immigrants | Nigeria | 90.9 /100 | #127 | Exceptional 5.9% |
| Immigrants | Western Asia | 90.7 /100 | #128 | Exceptional 5.9% |
| Immigrants | Norway | 90.5 /100 | #129 | Exceptional 5.9% |
| Immigrants | Kazakhstan | 89.7 /100 | #130 | Excellent 5.9% |
| Immigrants | Costa Rica | 89.5 /100 | #131 | Excellent 5.9% |
| Immigrants | Europe | 87.8 /100 | #132 | Excellent 6.0% |
| Immigrants | Immigrants | 86.9 /100 | #133 | Excellent 6.0% |
| Ute | 86.6 /100 | #134 | Excellent 6.0% |
| Immigrants | Italy | 85.0 /100 | #135 | Excellent 6.0% |
| Immigrants | North Macedonia | 84.1 /100 | #136 | Excellent 6.0% |
| Immigrants | Syria | 84.1 /100 | #137 | Excellent 6.0% |
Demographics Similar to Barbadians by Ambulatory Disability
In terms of ambulatory disability, the demographic groups most similar to Barbadians are Yaqui (6.8%, a difference of 0.13%), Immigrants from Barbados (6.8%, a difference of 0.16%), Pennsylvania German (6.8%, a difference of 0.20%), Immigrants from Jamaica (6.8%, a difference of 0.23%), and Immigrants from Caribbean (6.7%, a difference of 0.30%).
| Demographics | Rating | Rank | Ambulatory Disability |
| Immigrants | Guyana | 0.1 /100 | #275 | Tragic 6.7% |
| Celtics | 0.1 /100 | #276 | Tragic 6.7% |
| Jamaicans | 0.1 /100 | #277 | Tragic 6.7% |
| Immigrants | West Indies | 0.1 /100 | #278 | Tragic 6.7% |
| Immigrants | Caribbean | 0.0 /100 | #279 | Tragic 6.7% |
| Pennsylvania Germans | 0.0 /100 | #280 | Tragic 6.8% |
| Yaqui | 0.0 /100 | #281 | Tragic 6.8% |
| Barbadians | 0.0 /100 | #282 | Tragic 6.8% |
| Immigrants | Barbados | 0.0 /100 | #283 | Tragic 6.8% |
| Immigrants | Jamaica | 0.0 /100 | #284 | Tragic 6.8% |
| Fijians | 0.0 /100 | #285 | Tragic 6.8% |
| Yakama | 0.0 /100 | #286 | Tragic 6.8% |
| U.S. Virgin Islanders | 0.0 /100 | #287 | Tragic 6.8% |
| Immigrants | Nonimmigrants | 0.0 /100 | #288 | Tragic 6.9% |
| Immigrants | Dominica | 0.0 /100 | #289 | Tragic 6.9% |