Immigrants from Belgium vs Barbadian Ambulatory Disability
COMPARE
Immigrants from Belgium
Barbadian
Ambulatory Disability
Ambulatory Disability Comparison
Immigrants from Belgium
Barbadians
5.6%
AMBULATORY DISABILITY
99.7/ 100
METRIC RATING
61st/ 347
METRIC RANK
6.8%
AMBULATORY DISABILITY
0.0/ 100
METRIC RATING
282nd/ 347
METRIC RANK
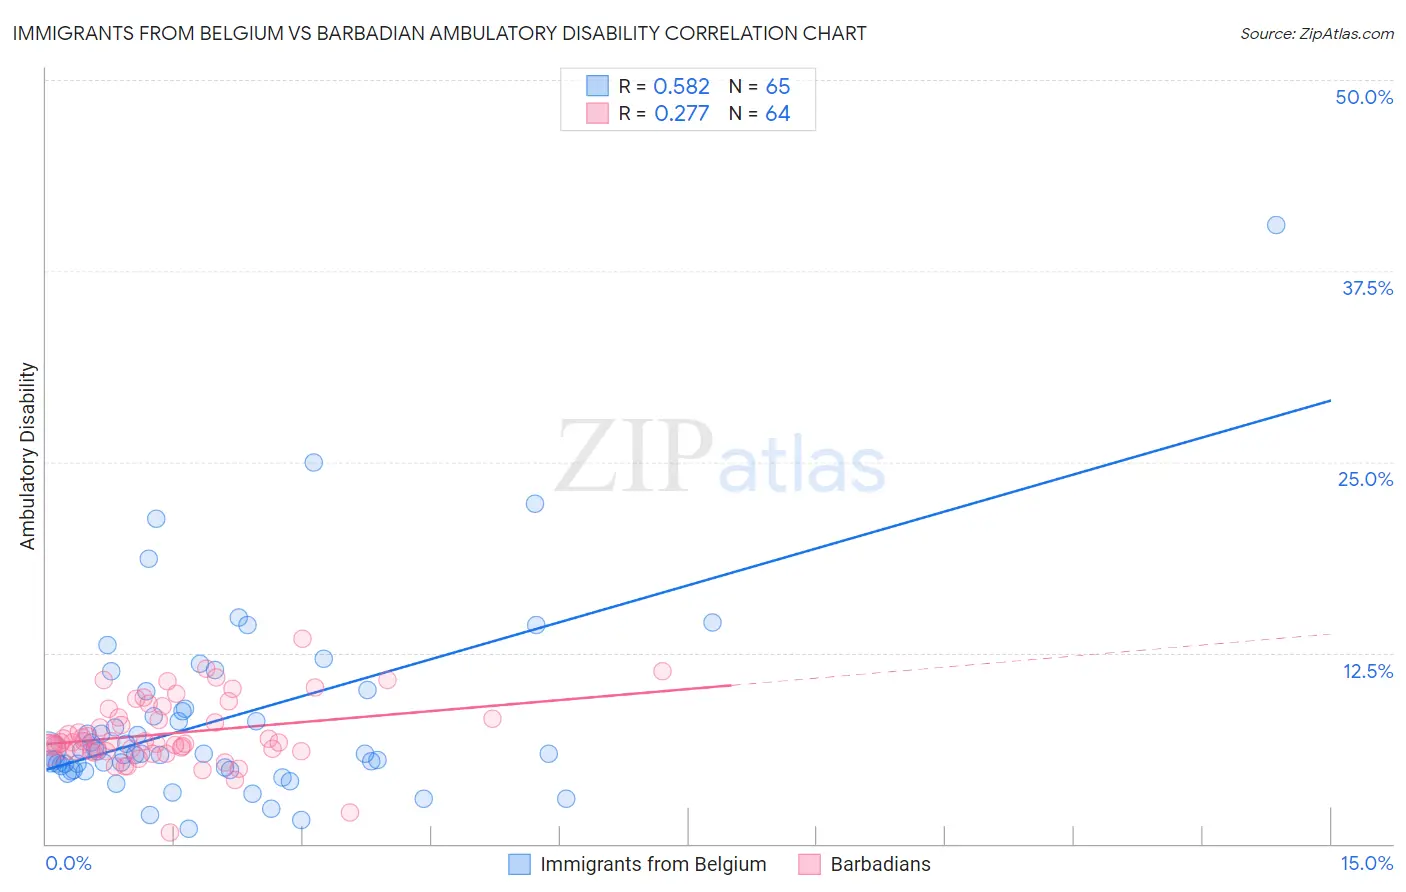
Immigrants from Belgium vs Barbadian Ambulatory Disability Correlation Chart
The statistical analysis conducted on geographies consisting of 146,707,151 people shows a substantial positive correlation between the proportion of Immigrants from Belgium and percentage of population with ambulatory disability in the United States with a correlation coefficient (R) of 0.582 and weighted average of 5.6%. Similarly, the statistical analysis conducted on geographies consisting of 141,286,079 people shows a weak positive correlation between the proportion of Barbadians and percentage of population with ambulatory disability in the United States with a correlation coefficient (R) of 0.277 and weighted average of 6.8%, a difference of 20.0%.
Ambulatory Disability Correlation Summary
| Measurement | Immigrants from Belgium | Barbadian |
| Minimum | 0.96% | 0.77% |
| Maximum | 40.5% | 13.4% |
| Range | 39.5% | 12.7% |
| Mean | 8.1% | 7.2% |
| Median | 5.9% | 6.7% |
| Interquartile 25% (IQ1) | 4.9% | 6.1% |
| Interquartile 75% (IQ3) | 9.4% | 8.6% |
| Interquartile Range (IQR) | 4.5% | 2.5% |
| Standard Deviation (Sample) | 6.3% | 2.2% |
| Standard Deviation (Population) | 6.3% | 2.2% |
Similar Demographics by Ambulatory Disability
Demographics Similar to Immigrants from Belgium by Ambulatory Disability
In terms of ambulatory disability, the demographic groups most similar to Immigrants from Belgium are Immigrants from Spain (5.6%, a difference of 0.010%), Immigrants from Lithuania (5.6%, a difference of 0.12%), Immigrants from France (5.6%, a difference of 0.13%), Immigrants from Afghanistan (5.6%, a difference of 0.16%), and Immigrants from Zimbabwe (5.6%, a difference of 0.20%).
| Demographics | Rating | Rank | Ambulatory Disability |
| Immigrants | Eastern Africa | 99.8 /100 | #54 | Exceptional 5.6% |
| Immigrants | Bulgaria | 99.8 /100 | #55 | Exceptional 5.6% |
| Inupiat | 99.8 /100 | #56 | Exceptional 5.6% |
| Immigrants | Brazil | 99.8 /100 | #57 | Exceptional 5.6% |
| Immigrants | Zimbabwe | 99.8 /100 | #58 | Exceptional 5.6% |
| Immigrants | Afghanistan | 99.8 /100 | #59 | Exceptional 5.6% |
| Immigrants | Lithuania | 99.8 /100 | #60 | Exceptional 5.6% |
| Immigrants | Belgium | 99.7 /100 | #61 | Exceptional 5.6% |
| Immigrants | Spain | 99.7 /100 | #62 | Exceptional 5.6% |
| Immigrants | France | 99.7 /100 | #63 | Exceptional 5.6% |
| Laotians | 99.7 /100 | #64 | Exceptional 5.7% |
| Immigrants | Switzerland | 99.7 /100 | #65 | Exceptional 5.7% |
| Israelis | 99.6 /100 | #66 | Exceptional 5.7% |
| Immigrants | Uganda | 99.6 /100 | #67 | Exceptional 5.7% |
| Sri Lankans | 99.6 /100 | #68 | Exceptional 5.7% |
Demographics Similar to Barbadians by Ambulatory Disability
In terms of ambulatory disability, the demographic groups most similar to Barbadians are Yaqui (6.8%, a difference of 0.13%), Immigrants from Barbados (6.8%, a difference of 0.16%), Pennsylvania German (6.8%, a difference of 0.20%), Immigrants from Jamaica (6.8%, a difference of 0.23%), and Immigrants from Caribbean (6.7%, a difference of 0.30%).
| Demographics | Rating | Rank | Ambulatory Disability |
| Immigrants | Guyana | 0.1 /100 | #275 | Tragic 6.7% |
| Celtics | 0.1 /100 | #276 | Tragic 6.7% |
| Jamaicans | 0.1 /100 | #277 | Tragic 6.7% |
| Immigrants | West Indies | 0.1 /100 | #278 | Tragic 6.7% |
| Immigrants | Caribbean | 0.0 /100 | #279 | Tragic 6.7% |
| Pennsylvania Germans | 0.0 /100 | #280 | Tragic 6.8% |
| Yaqui | 0.0 /100 | #281 | Tragic 6.8% |
| Barbadians | 0.0 /100 | #282 | Tragic 6.8% |
| Immigrants | Barbados | 0.0 /100 | #283 | Tragic 6.8% |
| Immigrants | Jamaica | 0.0 /100 | #284 | Tragic 6.8% |
| Fijians | 0.0 /100 | #285 | Tragic 6.8% |
| Yakama | 0.0 /100 | #286 | Tragic 6.8% |
| U.S. Virgin Islanders | 0.0 /100 | #287 | Tragic 6.8% |
| Immigrants | Nonimmigrants | 0.0 /100 | #288 | Tragic 6.9% |
| Immigrants | Dominica | 0.0 /100 | #289 | Tragic 6.9% |