Immigrants from Kazakhstan vs Maltese Ambulatory Disability
COMPARE
Immigrants from Kazakhstan
Maltese
Ambulatory Disability
Ambulatory Disability Comparison
Immigrants from Kazakhstan
Maltese
5.9%
AMBULATORY DISABILITY
89.7/ 100
METRIC RATING
130th/ 347
METRIC RANK
6.0%
AMBULATORY DISABILITY
81.6/ 100
METRIC RATING
150th/ 347
METRIC RANK
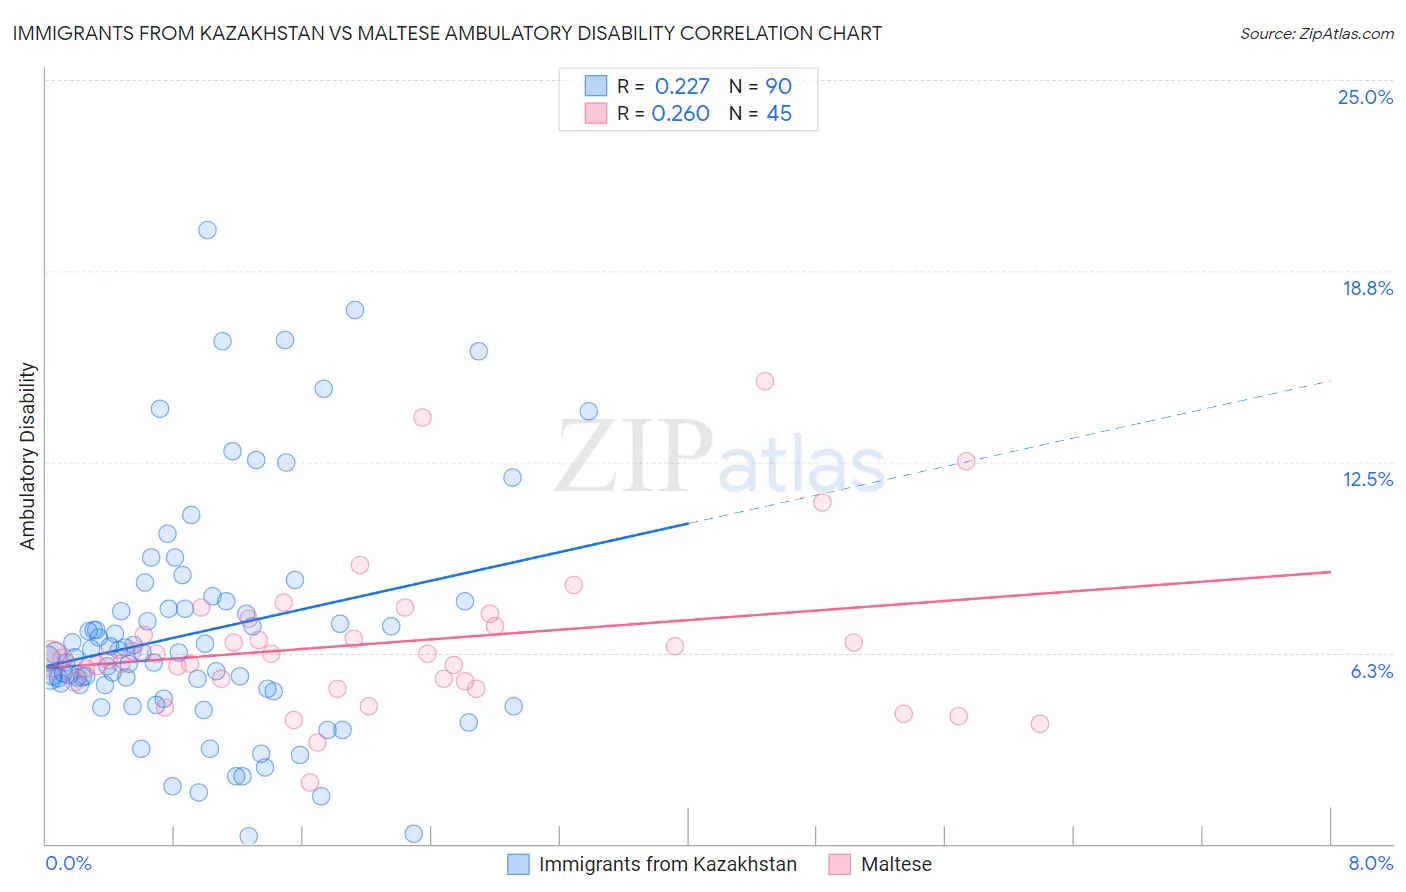
Immigrants from Kazakhstan vs Maltese Ambulatory Disability Correlation Chart
The statistical analysis conducted on geographies consisting of 124,443,278 people shows a weak positive correlation between the proportion of Immigrants from Kazakhstan and percentage of population with ambulatory disability in the United States with a correlation coefficient (R) of 0.227 and weighted average of 5.9%. Similarly, the statistical analysis conducted on geographies consisting of 126,465,300 people shows a weak positive correlation between the proportion of Maltese and percentage of population with ambulatory disability in the United States with a correlation coefficient (R) of 0.260 and weighted average of 6.0%, a difference of 0.92%.
Ambulatory Disability Correlation Summary
| Measurement | Immigrants from Kazakhstan | Maltese |
| Minimum | 0.25% | 2.0% |
| Maximum | 20.1% | 15.2% |
| Range | 19.9% | 13.2% |
| Mean | 6.9% | 6.6% |
| Median | 6.2% | 6.1% |
| Interquartile 25% (IQ1) | 5.1% | 5.3% |
| Interquartile 75% (IQ3) | 7.7% | 7.2% |
| Interquartile Range (IQR) | 2.6% | 1.9% |
| Standard Deviation (Sample) | 3.8% | 2.5% |
| Standard Deviation (Population) | 3.8% | 2.5% |
Demographics Similar to Immigrants from Kazakhstan and Maltese by Ambulatory Disability
In terms of ambulatory disability, the demographic groups most similar to Immigrants from Kazakhstan are Immigrants from Costa Rica (5.9%, a difference of 0.030%), Immigrants from Europe (6.0%, a difference of 0.27%), Immigrants (6.0%, a difference of 0.38%), Ute (6.0%, a difference of 0.42%), and Immigrants from Italy (6.0%, a difference of 0.59%). Similarly, the demographic groups most similar to Maltese are Lithuanian (6.0%, a difference of 0.020%), Immigrants from Eastern Europe (6.0%, a difference of 0.030%), Immigrants from Moldova (6.0%, a difference of 0.070%), Pakistani (6.0%, a difference of 0.080%), and Immigrants from Greece (6.0%, a difference of 0.080%).
| Demographics | Rating | Rank | Ambulatory Disability |
| Immigrants | Kazakhstan | 89.7 /100 | #130 | Excellent 5.9% |
| Immigrants | Costa Rica | 89.5 /100 | #131 | Excellent 5.9% |
| Immigrants | Europe | 87.8 /100 | #132 | Excellent 6.0% |
| Immigrants | Immigrants | 86.9 /100 | #133 | Excellent 6.0% |
| Ute | 86.6 /100 | #134 | Excellent 6.0% |
| Immigrants | Italy | 85.0 /100 | #135 | Excellent 6.0% |
| Immigrants | North Macedonia | 84.1 /100 | #136 | Excellent 6.0% |
| Immigrants | Syria | 84.1 /100 | #137 | Excellent 6.0% |
| Immigrants | Hungary | 83.9 /100 | #138 | Excellent 6.0% |
| Immigrants | Zaire | 83.6 /100 | #139 | Excellent 6.0% |
| Czechs | 83.3 /100 | #140 | Excellent 6.0% |
| Swedes | 83.1 /100 | #141 | Excellent 6.0% |
| Immigrants | Philippines | 83.0 /100 | #142 | Excellent 6.0% |
| Romanians | 82.9 /100 | #143 | Excellent 6.0% |
| Macedonians | 82.8 /100 | #144 | Excellent 6.0% |
| Pakistanis | 82.5 /100 | #145 | Excellent 6.0% |
| Immigrants | Greece | 82.5 /100 | #146 | Excellent 6.0% |
| Immigrants | Moldova | 82.4 /100 | #147 | Excellent 6.0% |
| Immigrants | Eastern Europe | 82.0 /100 | #148 | Excellent 6.0% |
| Lithuanians | 81.9 /100 | #149 | Excellent 6.0% |
| Maltese | 81.6 /100 | #150 | Excellent 6.0% |