Immigrants from North America vs Barbadian Ambulatory Disability
COMPARE
Immigrants from North America
Barbadian
Ambulatory Disability
Ambulatory Disability Comparison
Immigrants from North America
Barbadians
6.1%
AMBULATORY DISABILITY
45.6/ 100
METRIC RATING
176th/ 347
METRIC RANK
6.8%
AMBULATORY DISABILITY
0.0/ 100
METRIC RATING
282nd/ 347
METRIC RANK
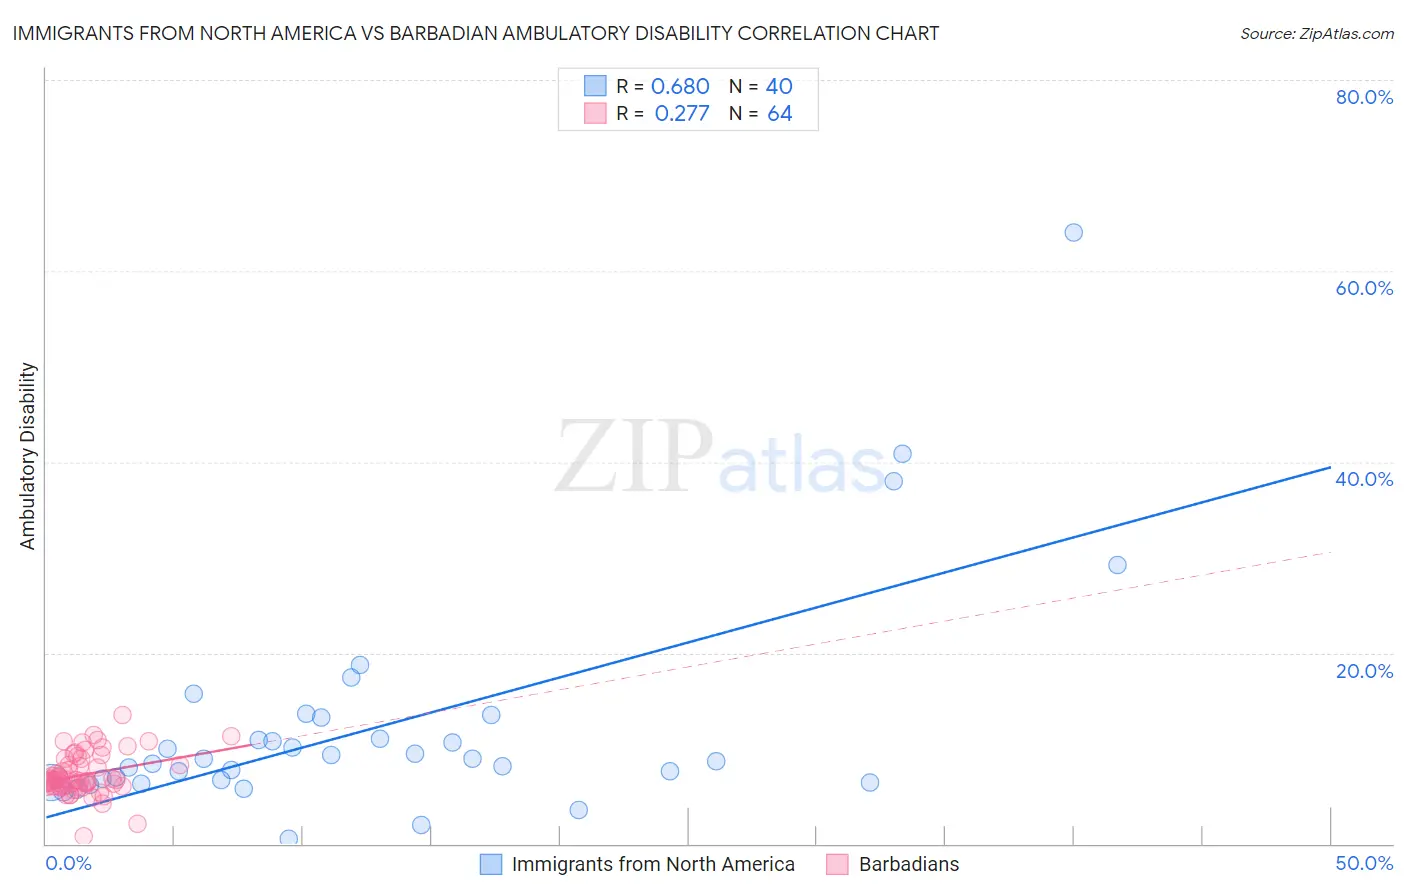
Immigrants from North America vs Barbadian Ambulatory Disability Correlation Chart
The statistical analysis conducted on geographies consisting of 462,310,418 people shows a significant positive correlation between the proportion of Immigrants from North America and percentage of population with ambulatory disability in the United States with a correlation coefficient (R) of 0.680 and weighted average of 6.1%. Similarly, the statistical analysis conducted on geographies consisting of 141,286,079 people shows a weak positive correlation between the proportion of Barbadians and percentage of population with ambulatory disability in the United States with a correlation coefficient (R) of 0.277 and weighted average of 6.8%, a difference of 10.3%.
Ambulatory Disability Correlation Summary
| Measurement | Immigrants from North America | Barbadian |
| Minimum | 0.55% | 0.77% |
| Maximum | 64.0% | 13.4% |
| Range | 63.4% | 12.7% |
| Mean | 12.2% | 7.2% |
| Median | 8.8% | 6.7% |
| Interquartile 25% (IQ1) | 6.5% | 6.1% |
| Interquartile 75% (IQ3) | 12.1% | 8.6% |
| Interquartile Range (IQR) | 5.6% | 2.5% |
| Standard Deviation (Sample) | 11.8% | 2.2% |
| Standard Deviation (Population) | 11.6% | 2.2% |
Similar Demographics by Ambulatory Disability
Demographics Similar to Immigrants from North America by Ambulatory Disability
In terms of ambulatory disability, the demographic groups most similar to Immigrants from North America are Immigrants from England (6.1%, a difference of 0.010%), Scandinavian (6.1%, a difference of 0.060%), Austrian (6.1%, a difference of 0.080%), Vietnamese (6.1%, a difference of 0.090%), and Immigrants from Nicaragua (6.1%, a difference of 0.090%).
| Demographics | Rating | Rank | Ambulatory Disability |
| Immigrants | Southern Europe | 58.1 /100 | #169 | Average 6.1% |
| Immigrants | Ecuador | 53.8 /100 | #170 | Average 6.1% |
| Moroccans | 52.6 /100 | #171 | Average 6.1% |
| Immigrants | Burma/Myanmar | 52.2 /100 | #172 | Average 6.1% |
| Croatians | 51.2 /100 | #173 | Average 6.1% |
| Immigrants | Canada | 50.0 /100 | #174 | Average 6.1% |
| Vietnamese | 47.2 /100 | #175 | Average 6.1% |
| Immigrants | North America | 45.6 /100 | #176 | Average 6.1% |
| Immigrants | England | 45.4 /100 | #177 | Average 6.1% |
| Scandinavians | 44.5 /100 | #178 | Average 6.1% |
| Austrians | 44.1 /100 | #179 | Average 6.1% |
| Immigrants | Nicaragua | 43.9 /100 | #180 | Average 6.1% |
| Swiss | 43.1 /100 | #181 | Average 6.1% |
| Serbians | 42.8 /100 | #182 | Average 6.1% |
| Immigrants | Thailand | 42.2 /100 | #183 | Average 6.1% |
Demographics Similar to Barbadians by Ambulatory Disability
In terms of ambulatory disability, the demographic groups most similar to Barbadians are Yaqui (6.8%, a difference of 0.13%), Immigrants from Barbados (6.8%, a difference of 0.16%), Pennsylvania German (6.8%, a difference of 0.20%), Immigrants from Jamaica (6.8%, a difference of 0.23%), and Immigrants from Caribbean (6.7%, a difference of 0.30%).
| Demographics | Rating | Rank | Ambulatory Disability |
| Immigrants | Guyana | 0.1 /100 | #275 | Tragic 6.7% |
| Celtics | 0.1 /100 | #276 | Tragic 6.7% |
| Jamaicans | 0.1 /100 | #277 | Tragic 6.7% |
| Immigrants | West Indies | 0.1 /100 | #278 | Tragic 6.7% |
| Immigrants | Caribbean | 0.0 /100 | #279 | Tragic 6.7% |
| Pennsylvania Germans | 0.0 /100 | #280 | Tragic 6.8% |
| Yaqui | 0.0 /100 | #281 | Tragic 6.8% |
| Barbadians | 0.0 /100 | #282 | Tragic 6.8% |
| Immigrants | Barbados | 0.0 /100 | #283 | Tragic 6.8% |
| Immigrants | Jamaica | 0.0 /100 | #284 | Tragic 6.8% |
| Fijians | 0.0 /100 | #285 | Tragic 6.8% |
| Yakama | 0.0 /100 | #286 | Tragic 6.8% |
| U.S. Virgin Islanders | 0.0 /100 | #287 | Tragic 6.8% |
| Immigrants | Nonimmigrants | 0.0 /100 | #288 | Tragic 6.9% |
| Immigrants | Dominica | 0.0 /100 | #289 | Tragic 6.9% |