Immigrants from Haiti vs Scandinavian Male Disability

COMPARE

Immigrants from Haiti
Race
Ancestry
AfghanAfricanAlaska NativeAlaskan AthabascanAlbanianAleutAlsatianAmericanApacheArabArapahoArgentineanArmenianAssyrian/Chaldean/SyriacAustralianAustrianBahamianBangladeshiBarbadianBasqueBelgianBelizeanBermudanBhutaneseBlackfeetBolivianBrazilianBritishBritish West IndianBulgarianBurmeseCajunCambodianCanadianCape VerdeanCarpatho RusynCelticCentral AmericanCentral American IndianCherokeeCheyenneChickasawChileanChineseChippewaChoctawColombianColvilleComancheCosta RicanCreeCreekCroatianCrowCubanCypriotCzechCzechoslovakianDanishDelawareDominicanDutchDutch West IndianEastern EuropeanEcuadorianEgyptianEnglishEstonianEthiopianEuropeanFijianFilipinoFinnishFrenchFrench American IndianFrench CanadianGermanGerman RussianGhanaianGreekGuamanian/ChamorroGuatemalanGuyaneseHaitianHmongHonduranHopiHoumaHungarianIcelanderIndian (Asian)IndonesianInupiatIranianIraqiIrishIroquoisIsraeliItalianJamaicanJapaneseJordanianKenyanKiowaKoreanLaotianLatvianLebaneseLiberianLithuanianLumbeeLuxembourgerMacedonianMalaysianMalteseMarshalleseMenomineeMexicanMexican American IndianMongolianMoroccanNative HawaiianNavajoNepaleseNew ZealanderNicaraguanNigerianNorthern EuropeanNorwegianOkinawanOsageOttawaPaiutePakistaniPalestinianPanamanianParaguayanPennsylvania GermanPeruvianPimaPolishPortuguesePotawatomiPuebloPuerto RicanPuget Sound SalishRomanianRussianSalvadoranSamoanScotch-IrishScottishSeminoleSenegaleseSerbianShoshoneSierra LeoneanSiouxSlavicSlovakSloveneSomaliSouth AfricanSouth AmericanSouth American IndianSoviet UnionSpaniardSpanishSpanish AmericanSpanish American IndianSri LankanSubsaharan AfricanSudaneseSwedishSwissSyrianTaiwaneseThaiTlingit-HaidaTohono O'OdhamTonganTrinidadian and TobagonianTsimshianTurkishU.S. Virgin IslanderUgandanUkrainianUruguayanUteVenezuelanVietnameseWelshWest IndianYakamaYaquiYugoslavianYumanYup'ikZimbabwean
Immigration
NonimmigrantsImmigrantsAfghanistanAfricaAlbaniaArgentinaArmeniaAsiaAustraliaAustriaBahamasBangladeshBarbadosBelarusBelgiumBelizeBoliviaBosnia and HerzegovinaBrazilBulgariaBurma/MyanmarCabo VerdeCambodiaCameroonCanadaCaribbeanCentral AmericaChileChinaColombiaCongoCosta RicaCroatiaCubaCzechoslovakiaDenmarkDominicaDominican RepublicEastern AfricaEastern AsiaEastern EuropeEcuadorEgyptEl SalvadorEnglandEritreaEthiopiaEuropeFijiFranceGermanyGhanaGreeceGrenadaGuatemalaGuyanaHaitiHondurasHong KongHungaryIndiaIndonesiaIranIraqIrelandIsraelItalyJamaicaJapanJordanKazakhstanKenyaKoreaKuwaitLaosLatin AmericaLatviaLebanonLiberiaLithuaniaMalaysiaMexicoMicronesiaMiddle AfricaMoldovaMoroccoNepalNetherlandsNicaraguaNigeriaNorth AmericaNorth MacedoniaNorthern AfricaNorthern EuropeNorwayOceaniaPakistanPanamaPeruPhilippinesPolandPortugalRomaniaRussiaSaudi ArabiaScotlandSenegalSerbiaSierra LeoneSingaporeSomaliaSouth AfricaSouth AmericaSouth Central AsiaSouth Eastern AsiaSouthern EuropeSpainSri LankaSt. Vincent and the GrenadinesSudanSwedenSwitzerlandSyriaTaiwanThailandTrinidad and TobagoTurkeyUgandaUkraineUruguayUzbekistanVenezuelaVietnamWest IndiesWestern AfricaWestern AsiaWestern EuropeYemenZaireZimbabweAzores
Scandinavian
Race
Ancestry
AfghanAfricanAlaska NativeAlaskan AthabascanAlbanianAleutAlsatianAmericanApacheArabArapahoArgentineanArmenianAssyrian/Chaldean/SyriacAustralianAustrianBahamianBangladeshiBarbadianBasqueBelgianBelizeanBermudanBhutaneseBlackfeetBolivianBrazilianBritishBritish West IndianBulgarianBurmeseCajunCambodianCanadianCape VerdeanCarpatho RusynCelticCentral AmericanCentral American IndianCherokeeCheyenneChickasawChileanChineseChippewaChoctawColombianColvilleComancheCosta RicanCreeCreekCroatianCrowCubanCypriotCzechCzechoslovakianDanishDelawareDominicanDutchDutch West IndianEastern EuropeanEcuadorianEgyptianEnglishEstonianEthiopianEuropeanFijianFilipinoFinnishFrenchFrench American IndianFrench CanadianGermanGerman RussianGhanaianGreekGuamanian/ChamorroGuatemalanGuyaneseHaitianHmongHonduranHopiHoumaHungarianIcelanderIndian (Asian)IndonesianInupiatIranianIraqiIrishIroquoisIsraeliItalianJamaicanJapaneseJordanianKenyanKiowaKoreanLaotianLatvianLebaneseLiberianLithuanianLumbeeLuxembourgerMacedonianMalaysianMalteseMarshalleseMenomineeMexicanMexican American IndianMongolianMoroccanNative HawaiianNavajoNepaleseNew ZealanderNicaraguanNigerianNorthern EuropeanNorwegianOkinawanOsageOttawaPaiutePakistaniPalestinianPanamanianParaguayanPennsylvania GermanPeruvianPimaPolishPortuguesePotawatomiPuebloPuerto RicanPuget Sound SalishRomanianRussianSalvadoranSamoanScandinavianScotch-IrishScottishSeminoleSenegaleseSerbianShoshoneSierra LeoneanSiouxSlavicSlovakSloveneSomaliSouth AfricanSouth AmericanSouth American IndianSoviet UnionSpaniardSpanishSpanish AmericanSpanish American IndianSri LankanSubsaharan AfricanSudaneseSwedishSwissSyrianTaiwaneseThaiTlingit-HaidaTohono O'OdhamTonganTrinidadian and TobagonianTsimshianTurkishU.S. Virgin IslanderUgandanUkrainianUruguayanUteVenezuelanVietnameseWelshWest IndianYakamaYaquiYugoslavianYumanYup'ikZimbabwean
Immigration
NonimmigrantsImmigrantsAfghanistanAfricaAlbaniaArgentinaArmeniaAsiaAustraliaAustriaBahamasBangladeshBarbadosBelarusBelgiumBelizeBoliviaBosnia and HerzegovinaBrazilBulgariaBurma/MyanmarCabo VerdeCambodiaCameroonCanadaCaribbeanCentral AmericaChileChinaColombiaCongoCosta RicaCroatiaCubaCzechoslovakiaDenmarkDominicaDominican RepublicEastern AfricaEastern AsiaEastern EuropeEcuadorEgyptEl SalvadorEnglandEritreaEthiopiaEuropeFijiFranceGermanyGhanaGreeceGrenadaGuatemalaGuyanaHondurasHong KongHungaryIndiaIndonesiaIranIraqIrelandIsraelItalyJamaicaJapanJordanKazakhstanKenyaKoreaKuwaitLaosLatin AmericaLatviaLebanonLiberiaLithuaniaMalaysiaMexicoMicronesiaMiddle AfricaMoldovaMoroccoNepalNetherlandsNicaraguaNigeriaNorth AmericaNorth MacedoniaNorthern AfricaNorthern EuropeNorwayOceaniaPakistanPanamaPeruPhilippinesPolandPortugalRomaniaRussiaSaudi ArabiaScotlandSenegalSerbiaSierra LeoneSingaporeSomaliaSouth AfricaSouth AmericaSouth Central AsiaSouth Eastern AsiaSouthern EuropeSpainSri LankaSt. Vincent and the GrenadinesSudanSwedenSwitzerlandSyriaTaiwanThailandTrinidad and TobagoTurkeyUgandaUkraineUruguayUzbekistanVenezuelaVietnamWest IndiesWestern AfricaWestern AsiaWestern EuropeYemenZaireZimbabweAzores
Male Disability
Income
Poverty
Unemployment
Labor Participation
Family Structure
Vehicle Availability
Education Level
Disability

Male Disability Comparison

Immigrants from Haiti

Scandinavians

Good
Tragic
11.1%
MALE DISABILITY
65.3/ 100
METRIC RATING
162nd/ 347
METRIC RANK
12.3%
MALE DISABILITY
0.1/ 100
METRIC RATING
271st/ 347
METRIC RANK

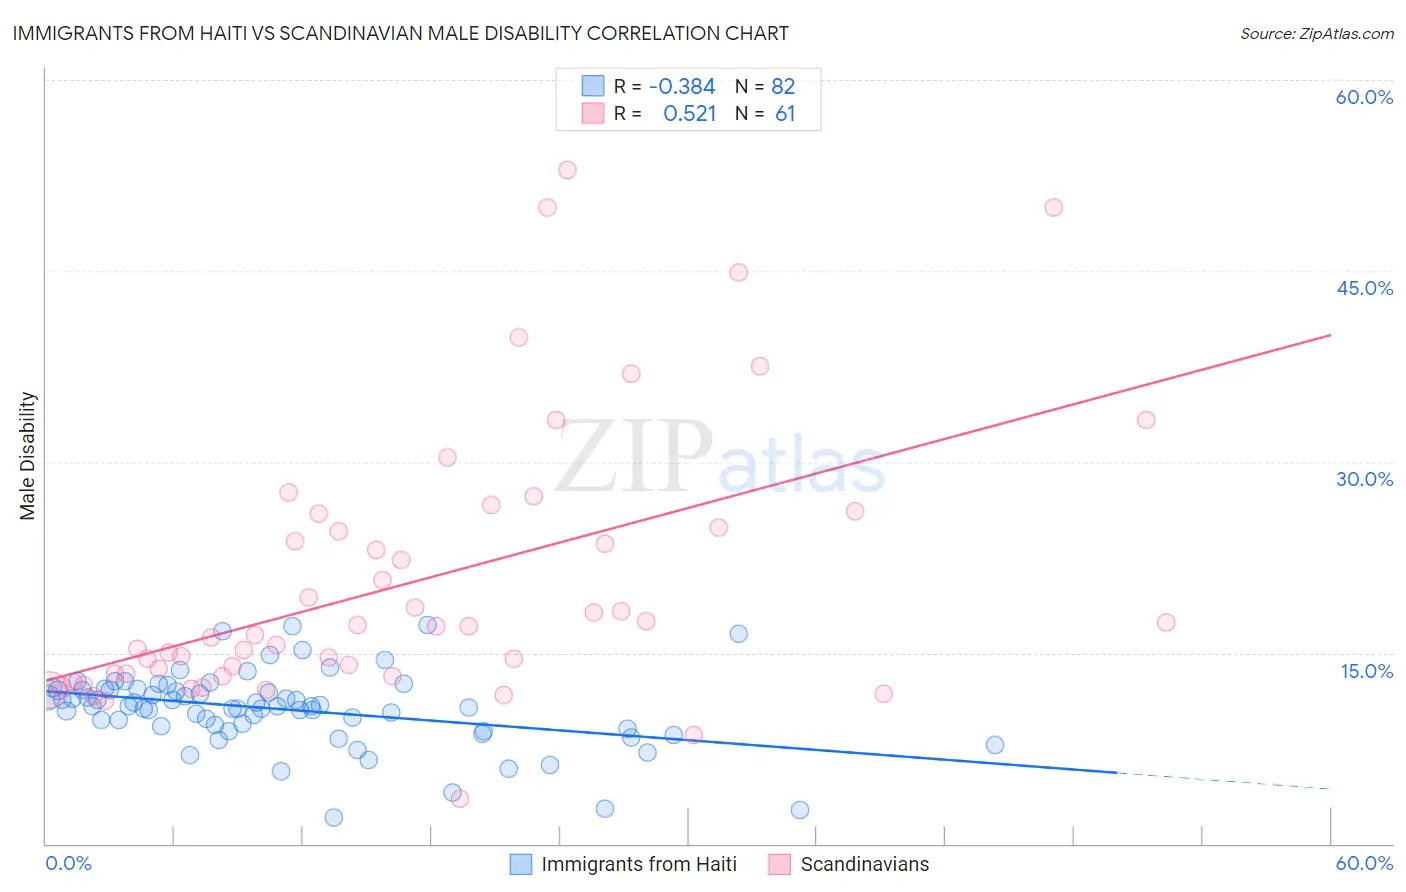
Immigrants from Haiti vs Scandinavian Male Disability Correlation Chart

The statistical analysis conducted on geographies consisting of 225,231,442 people shows a mild negative correlation between the proportion of Immigrants from Haiti and percentage of males with a disability in the United States with a correlation coefficient (R) of -0.384 and weighted average of 11.1%. Similarly, the statistical analysis conducted on geographies consisting of 472,512,703 people shows a substantial positive correlation between the proportion of Scandinavians and percentage of males with a disability in the United States with a correlation coefficient (R) of 0.521 and weighted average of 12.3%, a difference of 10.8%.
Immigrants from Haiti vs Scandinavian Male Disability

Male Disability Correlation Summary

MeasurementImmigrants from HaitiScandinavian
Minimum2.1%3.5%
Maximum17.2%52.9%
Range15.1%49.4%
Mean10.6%20.6%
Median10.8%17.0%
Interquartile 25% (IQ1)9.2%13.3%
Interquartile 75% (IQ3)12.1%25.4%
Interquartile Range (IQR)2.8%12.1%
Standard Deviation (Sample)2.9%10.7%
Standard Deviation (Population)2.9%10.7%

Similar Demographics by Male Disability

Demographics Similar to Immigrants from Haiti by Male Disability

In terms of male disability, the demographic groups most similar to Immigrants from Haiti are Immigrants from West Indies (11.1%, a difference of 0.020%), Albanian (11.1%, a difference of 0.070%), Immigrants from Kenya (11.1%, a difference of 0.090%), Guatemalan (11.1%, a difference of 0.12%), and British West Indian (11.1%, a difference of 0.15%).
DemographicsRating | RankMale Disability
Immigrants | Middle Africa
70.9
/100
|
#155
Good
11.1%
Russians
69.8
/100
|
#156
Good
11.1%
Immigrants | Western Africa
69.2
/100
|
#157
Good
11.1%
Latvians
68.1
/100
|
#158
Good
11.1%
Guatemalans
67.2
/100
|
#159
Good
11.1%
Albanians
66.5
/100
|
#160
Good
11.1%
Immigrants | West Indies
65.7
/100
|
#161
Good
11.1%
Immigrants | Haiti
65.3
/100
|
#162
Good
11.1%
Immigrants | Kenya
63.8
/100
|
#163
Good
11.1%
British West Indians
62.8
/100
|
#164
Good
11.1%
Luxembourgers
61.9
/100
|
#165
Good
11.1%
Immigrants | Hungary
61.2
/100
|
#166
Good
11.1%
Immigrants | Southern Europe
54.4
/100
|
#167
Average
11.2%
Immigrants | Latin America
54.0
/100
|
#168
Average
11.2%
Barbadians
53.4
/100
|
#169
Average
11.2%

Demographics Similar to Scandinavians by Male Disability

In terms of male disability, the demographic groups most similar to Scandinavians are Spaniard (12.3%, a difference of 0.19%), Portuguese (12.3%, a difference of 0.27%), Czechoslovakian (12.3%, a difference of 0.27%), Immigrants from Germany (12.3%, a difference of 0.40%), and Hawaiian (12.3%, a difference of 0.45%).
DemographicsRating | RankMale Disability
Nepalese
0.2
/100
|
#264
Tragic
12.2%
Immigrants | Portugal
0.1
/100
|
#265
Tragic
12.3%
Hawaiians
0.1
/100
|
#266
Tragic
12.3%
Immigrants | Germany
0.1
/100
|
#267
Tragic
12.3%
Portuguese
0.1
/100
|
#268
Tragic
12.3%
Czechoslovakians
0.1
/100
|
#269
Tragic
12.3%
Spaniards
0.1
/100
|
#270
Tragic
12.3%
Scandinavians
0.1
/100
|
#271
Tragic
12.3%
Hmong
0.0
/100
|
#272
Tragic
12.5%
Native Hawaiians
0.0
/100
|
#273
Tragic
12.5%
Hopi
0.0
/100
|
#274
Tragic
12.5%
Fijians
0.0
/100
|
#275
Tragic
12.6%
Africans
0.0
/100
|
#276
Tragic
12.6%
Finns
0.0
/100
|
#277
Tragic
12.6%
Central American Indians
0.0
/100
|
#278
Tragic
12.7%