Immigrants from Fiji vs Immigrants from Congo Hearing Disability
COMPARE
Immigrants from Fiji
Immigrants from Congo
Hearing Disability
Hearing Disability Comparison
Immigrants from Fiji
Immigrants from Congo
2.9%
HEARING DISABILITY
67.1/ 100
METRIC RATING
160th/ 347
METRIC RANK
2.9%
HEARING DISABILITY
78.9/ 100
METRIC RATING
145th/ 347
METRIC RANK
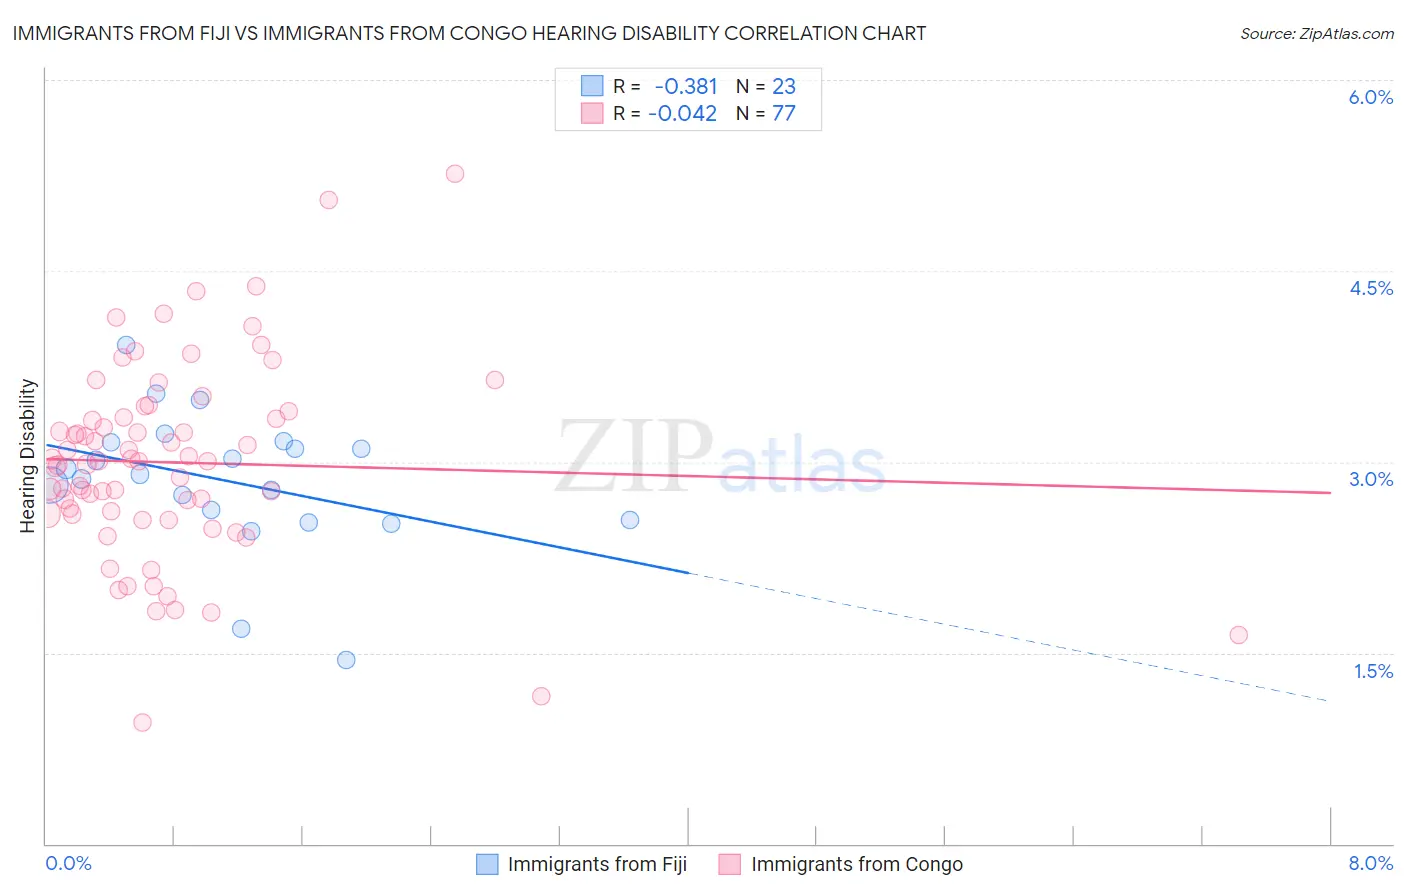
Immigrants from Fiji vs Immigrants from Congo Hearing Disability Correlation Chart
The statistical analysis conducted on geographies consisting of 93,738,910 people shows a mild negative correlation between the proportion of Immigrants from Fiji and percentage of population with hearing disability in the United States with a correlation coefficient (R) of -0.381 and weighted average of 2.9%. Similarly, the statistical analysis conducted on geographies consisting of 92,119,695 people shows no correlation between the proportion of Immigrants from Congo and percentage of population with hearing disability in the United States with a correlation coefficient (R) of -0.042 and weighted average of 2.9%, a difference of 1.5%.
Hearing Disability Correlation Summary
| Measurement | Immigrants from Fiji | Immigrants from Congo |
| Minimum | 1.4% | 0.95% |
| Maximum | 3.9% | 5.3% |
| Range | 2.5% | 4.3% |
| Mean | 2.9% | 3.0% |
| Median | 2.9% | 3.0% |
| Interquartile 25% (IQ1) | 2.5% | 2.6% |
| Interquartile 75% (IQ3) | 3.2% | 3.4% |
| Interquartile Range (IQR) | 0.61% | 0.79% |
| Standard Deviation (Sample) | 0.54% | 0.77% |
| Standard Deviation (Population) | 0.53% | 0.77% |
Demographics Similar to Immigrants from Fiji and Immigrants from Congo by Hearing Disability
In terms of hearing disability, the demographic groups most similar to Immigrants from Fiji are Immigrants from Australia (2.9%, a difference of 0.020%), Albanian (2.9%, a difference of 0.060%), Immigrants from Japan (2.9%, a difference of 0.090%), Immigrants from Burma/Myanmar (2.9%, a difference of 0.26%), and Immigrants from Kazakhstan (2.9%, a difference of 0.27%). Similarly, the demographic groups most similar to Immigrants from Congo are Brazilian (2.9%, a difference of 0.020%), Tongan (2.9%, a difference of 0.030%), Immigrants from Bulgaria (2.9%, a difference of 0.050%), Immigrants from Russia (2.9%, a difference of 0.17%), and Immigrants from Panama (2.9%, a difference of 0.28%).
| Demographics | Rating | Rank | Hearing Disability |
| Laotians | 81.1 /100 | #142 | Excellent 2.9% |
| Immigrants | Bahamas | 80.9 /100 | #143 | Excellent 2.9% |
| Immigrants | Bulgaria | 79.2 /100 | #144 | Good 2.9% |
| Immigrants | Congo | 78.9 /100 | #145 | Good 2.9% |
| Brazilians | 78.7 /100 | #146 | Good 2.9% |
| Tongans | 78.6 /100 | #147 | Good 2.9% |
| Immigrants | Russia | 77.7 /100 | #148 | Good 2.9% |
| Immigrants | Panama | 76.9 /100 | #149 | Good 2.9% |
| Palestinians | 73.6 /100 | #150 | Good 2.9% |
| Immigrants | France | 73.1 /100 | #151 | Good 2.9% |
| Immigrants | Lithuania | 73.0 /100 | #152 | Good 2.9% |
| Sudanese | 72.1 /100 | #153 | Good 2.9% |
| Immigrants | Lebanon | 71.5 /100 | #154 | Good 2.9% |
| Costa Ricans | 71.4 /100 | #155 | Good 2.9% |
| Immigrants | Poland | 70.2 /100 | #156 | Good 2.9% |
| Immigrants | Kazakhstan | 69.6 /100 | #157 | Good 2.9% |
| Immigrants | Burma/Myanmar | 69.5 /100 | #158 | Good 2.9% |
| Immigrants | Australia | 67.4 /100 | #159 | Good 2.9% |
| Immigrants | Fiji | 67.1 /100 | #160 | Good 2.9% |
| Albanians | 66.6 /100 | #161 | Good 2.9% |
| Immigrants | Japan | 66.3 /100 | #162 | Good 2.9% |