Somali vs Immigrants from Congo Hearing Disability
COMPARE
Somali
Immigrants from Congo
Hearing Disability
Hearing Disability Comparison
Somalis
Immigrants from Congo
2.8%
HEARING DISABILITY
96.7/ 100
METRIC RATING
87th/ 347
METRIC RANK
2.9%
HEARING DISABILITY
78.9/ 100
METRIC RATING
145th/ 347
METRIC RANK
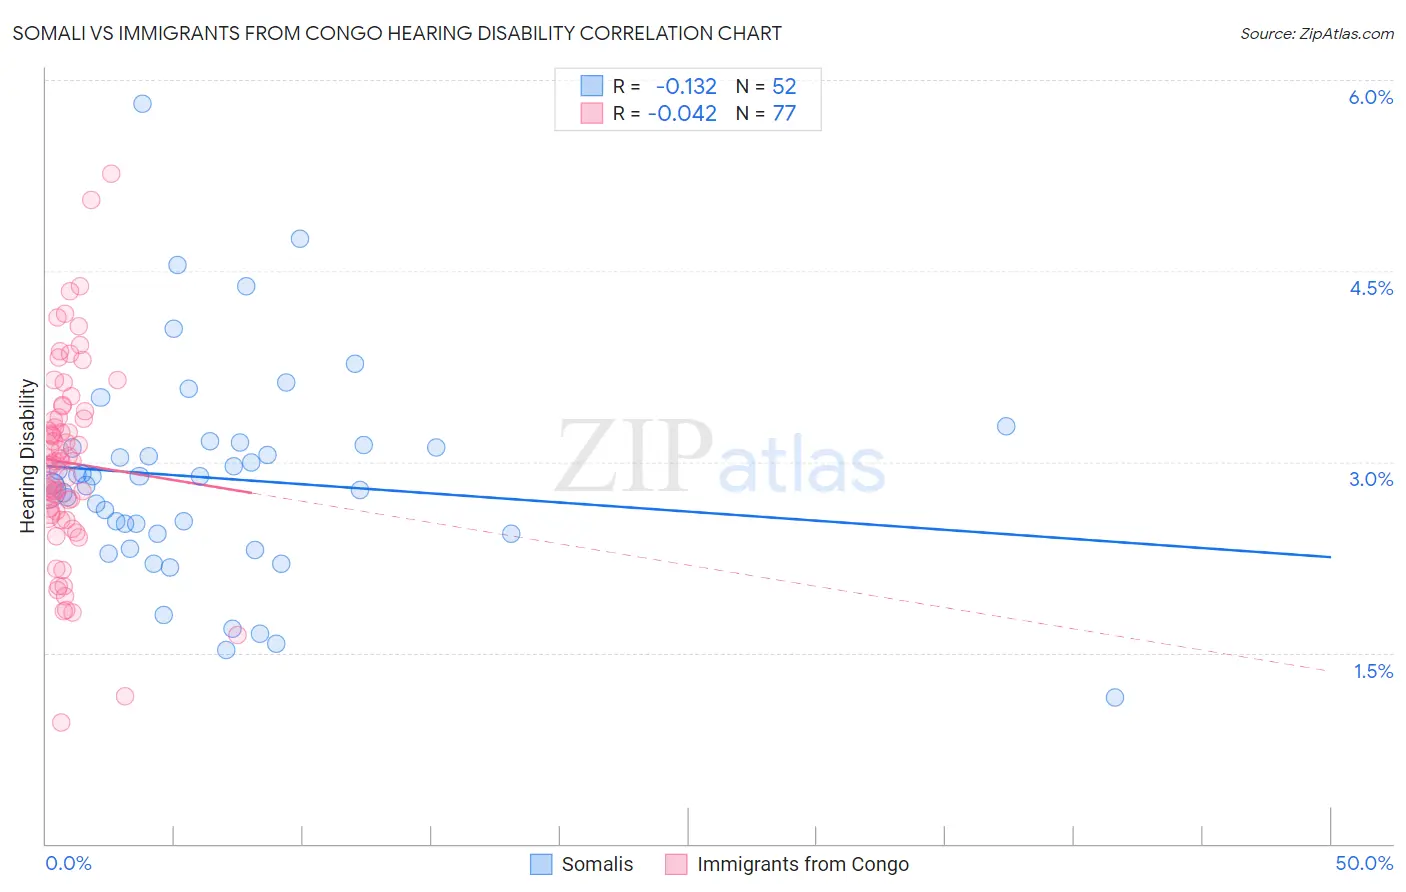
Somali vs Immigrants from Congo Hearing Disability Correlation Chart
The statistical analysis conducted on geographies consisting of 99,308,769 people shows a poor negative correlation between the proportion of Somalis and percentage of population with hearing disability in the United States with a correlation coefficient (R) of -0.132 and weighted average of 2.8%. Similarly, the statistical analysis conducted on geographies consisting of 92,119,695 people shows no correlation between the proportion of Immigrants from Congo and percentage of population with hearing disability in the United States with a correlation coefficient (R) of -0.042 and weighted average of 2.9%, a difference of 5.3%.
Hearing Disability Correlation Summary
| Measurement | Somali | Immigrants from Congo |
| Minimum | 1.1% | 0.95% |
| Maximum | 5.8% | 5.3% |
| Range | 4.7% | 4.3% |
| Mean | 2.9% | 3.0% |
| Median | 2.9% | 3.0% |
| Interquartile 25% (IQ1) | 2.4% | 2.6% |
| Interquartile 75% (IQ3) | 3.1% | 3.4% |
| Interquartile Range (IQR) | 0.68% | 0.79% |
| Standard Deviation (Sample) | 0.83% | 0.77% |
| Standard Deviation (Population) | 0.83% | 0.77% |
Similar Demographics by Hearing Disability
Demographics Similar to Somalis by Hearing Disability
In terms of hearing disability, the demographic groups most similar to Somalis are Immigrants from Turkey (2.8%, a difference of 0.040%), Belizean (2.8%, a difference of 0.070%), Immigrants from Morocco (2.8%, a difference of 0.090%), Immigrants from Iran (2.8%, a difference of 0.11%), and Immigrants from Northern Africa (2.8%, a difference of 0.13%).
| Demographics | Rating | Rank | Hearing Disability |
| Immigrants | Asia | 97.2 /100 | #80 | Exceptional 2.7% |
| Immigrants | Uruguay | 97.2 /100 | #81 | Exceptional 2.7% |
| Immigrants | Armenia | 97.2 /100 | #82 | Exceptional 2.7% |
| Immigrants | Cuba | 97.2 /100 | #83 | Exceptional 2.7% |
| Immigrants | Argentina | 97.0 /100 | #84 | Exceptional 2.8% |
| Immigrants | Northern Africa | 96.9 /100 | #85 | Exceptional 2.8% |
| Immigrants | Iran | 96.8 /100 | #86 | Exceptional 2.8% |
| Somalis | 96.7 /100 | #87 | Exceptional 2.8% |
| Immigrants | Turkey | 96.7 /100 | #88 | Exceptional 2.8% |
| Belizeans | 96.6 /100 | #89 | Exceptional 2.8% |
| Immigrants | Morocco | 96.6 /100 | #90 | Exceptional 2.8% |
| Immigrants | Middle Africa | 96.5 /100 | #91 | Exceptional 2.8% |
| Iranians | 96.4 /100 | #92 | Exceptional 2.8% |
| Immigrants | Kuwait | 96.3 /100 | #93 | Exceptional 2.8% |
| Uruguayans | 95.9 /100 | #94 | Exceptional 2.8% |
Demographics Similar to Immigrants from Congo by Hearing Disability
In terms of hearing disability, the demographic groups most similar to Immigrants from Congo are Brazilian (2.9%, a difference of 0.020%), Tongan (2.9%, a difference of 0.030%), Immigrants from Bulgaria (2.9%, a difference of 0.050%), Immigrants from Russia (2.9%, a difference of 0.17%), and Immigrants from Panama (2.9%, a difference of 0.28%).
| Demographics | Rating | Rank | Hearing Disability |
| Immigrants | Costa Rica | 84.0 /100 | #138 | Excellent 2.9% |
| Bermudans | 83.8 /100 | #139 | Excellent 2.9% |
| Immigrants | Jordan | 83.7 /100 | #140 | Excellent 2.9% |
| Sub-Saharan Africans | 83.3 /100 | #141 | Excellent 2.9% |
| Laotians | 81.1 /100 | #142 | Excellent 2.9% |
| Immigrants | Bahamas | 80.9 /100 | #143 | Excellent 2.9% |
| Immigrants | Bulgaria | 79.2 /100 | #144 | Good 2.9% |
| Immigrants | Congo | 78.9 /100 | #145 | Good 2.9% |
| Brazilians | 78.7 /100 | #146 | Good 2.9% |
| Tongans | 78.6 /100 | #147 | Good 2.9% |
| Immigrants | Russia | 77.7 /100 | #148 | Good 2.9% |
| Immigrants | Panama | 76.9 /100 | #149 | Good 2.9% |
| Palestinians | 73.6 /100 | #150 | Good 2.9% |
| Immigrants | France | 73.1 /100 | #151 | Good 2.9% |
| Immigrants | Lithuania | 73.0 /100 | #152 | Good 2.9% |