Immigrants from Eritrea vs Romanian Self-Care Disability
COMPARE
Immigrants from Eritrea
Romanian
Self-Care Disability
Self-Care Disability Comparison
Immigrants from Eritrea
Romanians
2.2%
SELF-CARE DISABILITY
100.0/ 100
METRIC RATING
19th/ 347
METRIC RANK
2.4%
SELF-CARE DISABILITY
75.8/ 100
METRIC RATING
148th/ 347
METRIC RANK
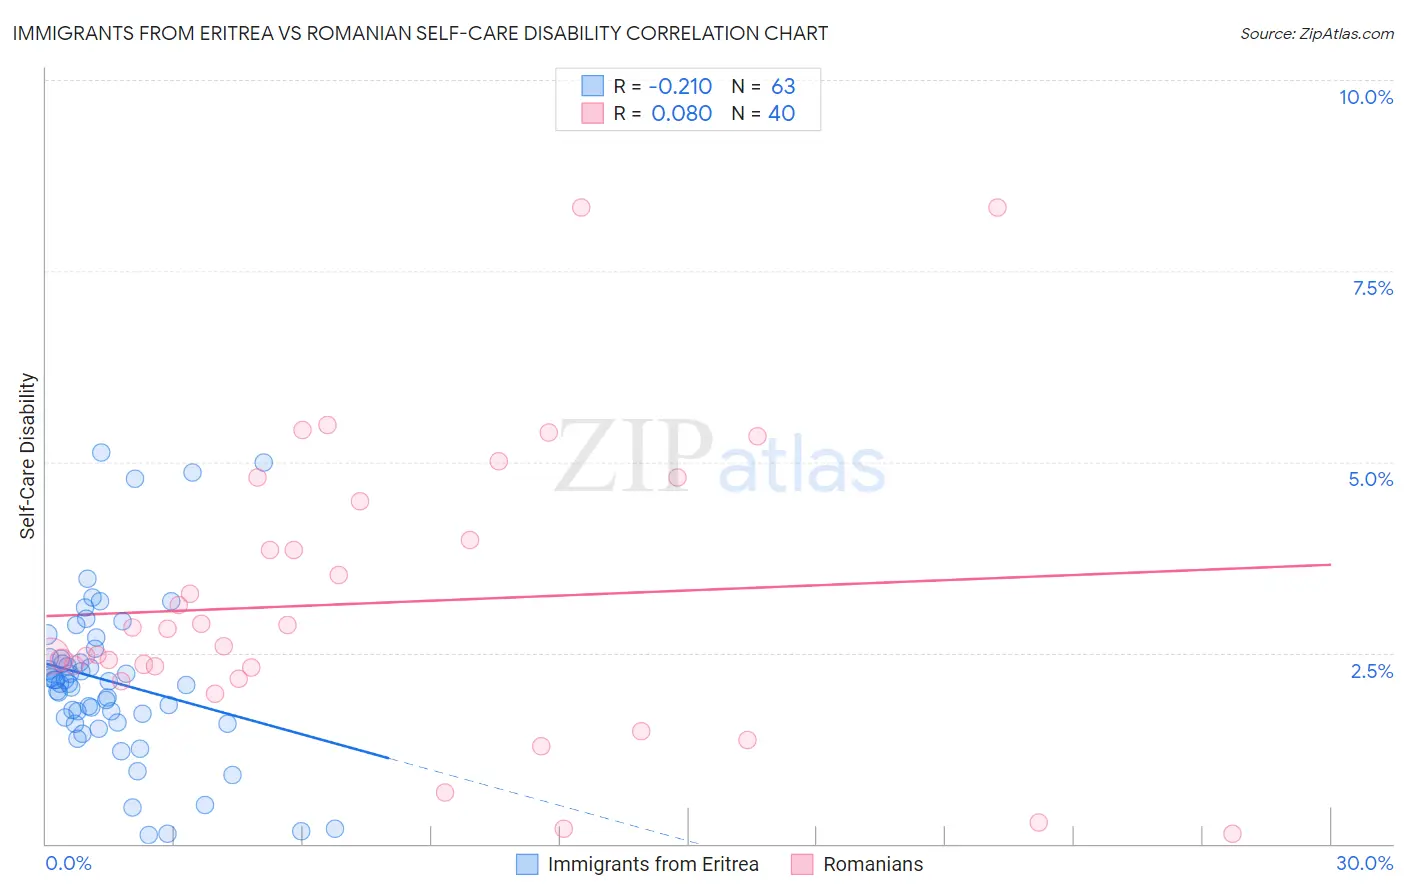
Immigrants from Eritrea vs Romanian Self-Care Disability Correlation Chart
The statistical analysis conducted on geographies consisting of 104,840,277 people shows a weak negative correlation between the proportion of Immigrants from Eritrea and percentage of population with self-care disability in the United States with a correlation coefficient (R) of -0.210 and weighted average of 2.2%. Similarly, the statistical analysis conducted on geographies consisting of 377,466,974 people shows a slight positive correlation between the proportion of Romanians and percentage of population with self-care disability in the United States with a correlation coefficient (R) of 0.080 and weighted average of 2.4%, a difference of 9.6%.
Self-Care Disability Correlation Summary
| Measurement | Immigrants from Eritrea | Romanian |
| Minimum | 0.11% | 0.12% |
| Maximum | 5.1% | 8.3% |
| Range | 5.0% | 8.2% |
| Mean | 2.1% | 3.2% |
| Median | 2.1% | 2.7% |
| Interquartile 25% (IQ1) | 1.6% | 2.2% |
| Interquartile 75% (IQ3) | 2.4% | 4.2% |
| Interquartile Range (IQR) | 0.85% | 2.0% |
| Standard Deviation (Sample) | 1.1% | 1.9% |
| Standard Deviation (Population) | 1.1% | 1.9% |
Similar Demographics by Self-Care Disability
Demographics Similar to Immigrants from Eritrea by Self-Care Disability
In terms of self-care disability, the demographic groups most similar to Immigrants from Eritrea are Tongan (2.2%, a difference of 0.080%), Immigrants from Taiwan (2.2%, a difference of 0.33%), Bulgarian (2.2%, a difference of 0.33%), Immigrants from Venezuela (2.2%, a difference of 0.36%), and Cambodian (2.2%, a difference of 0.58%).
| Demographics | Rating | Rank | Self-Care Disability |
| Immigrants | Ethiopia | 100.0 /100 | #12 | Exceptional 2.2% |
| Ethiopians | 100.0 /100 | #13 | Exceptional 2.2% |
| Luxembourgers | 100.0 /100 | #14 | Exceptional 2.2% |
| Okinawans | 100.0 /100 | #15 | Exceptional 2.2% |
| Immigrants | Kuwait | 100.0 /100 | #16 | Exceptional 2.2% |
| Immigrants | Saudi Arabia | 100.0 /100 | #17 | Exceptional 2.2% |
| Immigrants | Taiwan | 100.0 /100 | #18 | Exceptional 2.2% |
| Immigrants | Eritrea | 100.0 /100 | #19 | Exceptional 2.2% |
| Tongans | 100.0 /100 | #20 | Exceptional 2.2% |
| Bulgarians | 100.0 /100 | #21 | Exceptional 2.2% |
| Immigrants | Venezuela | 100.0 /100 | #22 | Exceptional 2.2% |
| Cambodians | 100.0 /100 | #23 | Exceptional 2.2% |
| Cypriots | 100.0 /100 | #24 | Exceptional 2.2% |
| Turks | 100.0 /100 | #25 | Exceptional 2.2% |
| Immigrants | Sri Lanka | 99.9 /100 | #26 | Exceptional 2.2% |
Demographics Similar to Romanians by Self-Care Disability
In terms of self-care disability, the demographic groups most similar to Romanians are Arab (2.4%, a difference of 0.010%), Immigrants from Costa Rica (2.4%, a difference of 0.050%), Dutch (2.4%, a difference of 0.11%), Basque (2.4%, a difference of 0.12%), and Tlingit-Haida (2.4%, a difference of 0.15%).
| Demographics | Rating | Rank | Self-Care Disability |
| Alaska Natives | 84.5 /100 | #141 | Excellent 2.4% |
| Immigrants | Peru | 83.2 /100 | #142 | Excellent 2.4% |
| Afghans | 82.3 /100 | #143 | Excellent 2.4% |
| Costa Ricans | 80.8 /100 | #144 | Excellent 2.4% |
| Germans | 80.1 /100 | #145 | Excellent 2.4% |
| Israelis | 80.0 /100 | #146 | Good 2.4% |
| Dutch | 77.5 /100 | #147 | Good 2.4% |
| Romanians | 75.8 /100 | #148 | Good 2.4% |
| Arabs | 75.7 /100 | #149 | Good 2.4% |
| Immigrants | Costa Rica | 75.1 /100 | #150 | Good 2.4% |
| Basques | 74.0 /100 | #151 | Good 2.4% |
| Tlingit-Haida | 73.5 /100 | #152 | Good 2.4% |
| Immigrants | England | 73.5 /100 | #153 | Good 2.4% |
| Italians | 72.2 /100 | #154 | Good 2.4% |
| Pakistanis | 71.4 /100 | #155 | Good 2.4% |