Immigrants from Czechoslovakia vs Immigrants from Kenya Disability

COMPARE

Immigrants from Czechoslovakia
Race
Ancestry
AfghanAfricanAlaska NativeAlaskan AthabascanAlbanianAleutAlsatianAmericanApacheArabArapahoArgentineanArmenianAssyrian/Chaldean/SyriacAustralianAustrianBahamianBangladeshiBarbadianBasqueBelgianBelizeanBermudanBhutaneseBlackfeetBolivianBrazilianBritishBritish West IndianBulgarianBurmeseCajunCambodianCanadianCape VerdeanCarpatho RusynCelticCentral AmericanCentral American IndianCherokeeCheyenneChickasawChileanChineseChippewaChoctawColombianColvilleComancheCosta RicanCreeCreekCroatianCrowCubanCypriotCzechCzechoslovakianDanishDelawareDominicanDutchDutch West IndianEastern EuropeanEcuadorianEgyptianEnglishEstonianEthiopianEuropeanFijianFilipinoFinnishFrenchFrench American IndianFrench CanadianGermanGerman RussianGhanaianGreekGuamanian/ChamorroGuatemalanGuyaneseHaitianHmongHonduranHopiHoumaHungarianIcelanderIndian (Asian)IndonesianInupiatIranianIraqiIrishIroquoisIsraeliItalianJamaicanJapaneseJordanianKenyanKiowaKoreanLaotianLatvianLebaneseLiberianLithuanianLumbeeLuxembourgerMacedonianMalaysianMalteseMarshalleseMenomineeMexicanMexican American IndianMongolianMoroccanNative HawaiianNavajoNepaleseNew ZealanderNicaraguanNigerianNorthern EuropeanNorwegianOkinawanOsageOttawaPaiutePakistaniPalestinianPanamanianParaguayanPennsylvania GermanPeruvianPimaPolishPortuguesePotawatomiPuebloPuerto RicanPuget Sound SalishRomanianRussianSalvadoranSamoanScandinavianScotch-IrishScottishSeminoleSenegaleseSerbianShoshoneSierra LeoneanSiouxSlavicSlovakSloveneSomaliSouth AfricanSouth AmericanSouth American IndianSoviet UnionSpaniardSpanishSpanish AmericanSpanish American IndianSri LankanSubsaharan AfricanSudaneseSwedishSwissSyrianTaiwaneseThaiTlingit-HaidaTohono O'OdhamTonganTrinidadian and TobagonianTsimshianTurkishU.S. Virgin IslanderUgandanUkrainianUruguayanUteVenezuelanVietnameseWelshWest IndianYakamaYaquiYugoslavianYumanYup'ikZimbabwean
Immigration
NonimmigrantsImmigrantsAfghanistanAfricaAlbaniaArgentinaArmeniaAsiaAustraliaAustriaBahamasBangladeshBarbadosBelarusBelgiumBelizeBoliviaBosnia and HerzegovinaBrazilBulgariaBurma/MyanmarCabo VerdeCambodiaCameroonCanadaCaribbeanCentral AmericaChileChinaColombiaCongoCosta RicaCroatiaCubaCzechoslovakiaDenmarkDominicaDominican RepublicEastern AfricaEastern AsiaEastern EuropeEcuadorEgyptEl SalvadorEnglandEritreaEthiopiaEuropeFijiFranceGermanyGhanaGreeceGrenadaGuatemalaGuyanaHaitiHondurasHong KongHungaryIndiaIndonesiaIranIraqIrelandIsraelItalyJamaicaJapanJordanKazakhstanKoreaKuwaitLaosLatin AmericaLatviaLebanonLiberiaLithuaniaMalaysiaMexicoMicronesiaMiddle AfricaMoldovaMoroccoNepalNetherlandsNicaraguaNigeriaNorth AmericaNorth MacedoniaNorthern AfricaNorthern EuropeNorwayOceaniaPakistanPanamaPeruPhilippinesPolandPortugalRomaniaRussiaSaudi ArabiaScotlandSenegalSerbiaSierra LeoneSingaporeSomaliaSouth AfricaSouth AmericaSouth Central AsiaSouth Eastern AsiaSouthern EuropeSpainSri LankaSt. Vincent and the GrenadinesSudanSwedenSwitzerlandSyriaTaiwanThailandTrinidad and TobagoTurkeyUgandaUkraineUruguayUzbekistanVenezuelaVietnamWest IndiesWestern AfricaWestern AsiaWestern EuropeYemenZaireZimbabweAzores
Immigrants from Kenya
Race
Ancestry
AfghanAfricanAlaska NativeAlaskan AthabascanAlbanianAleutAlsatianAmericanApacheArabArapahoArgentineanArmenianAssyrian/Chaldean/SyriacAustralianAustrianBahamianBangladeshiBarbadianBasqueBelgianBelizeanBermudanBhutaneseBlackfeetBolivianBrazilianBritishBritish West IndianBulgarianBurmeseCajunCambodianCanadianCape VerdeanCarpatho RusynCelticCentral AmericanCentral American IndianCherokeeCheyenneChickasawChileanChineseChippewaChoctawColombianColvilleComancheCosta RicanCreeCreekCroatianCrowCubanCypriotCzechCzechoslovakianDanishDelawareDominicanDutchDutch West IndianEastern EuropeanEcuadorianEgyptianEnglishEstonianEthiopianEuropeanFijianFilipinoFinnishFrenchFrench American IndianFrench CanadianGermanGerman RussianGhanaianGreekGuamanian/ChamorroGuatemalanGuyaneseHaitianHmongHonduranHopiHoumaHungarianIcelanderIndian (Asian)IndonesianInupiatIranianIraqiIrishIroquoisIsraeliItalianJamaicanJapaneseJordanianKenyanKiowaKoreanLaotianLatvianLebaneseLiberianLithuanianLumbeeLuxembourgerMacedonianMalaysianMalteseMarshalleseMenomineeMexicanMexican American IndianMongolianMoroccanNative HawaiianNavajoNepaleseNew ZealanderNicaraguanNigerianNorthern EuropeanNorwegianOkinawanOsageOttawaPaiutePakistaniPalestinianPanamanianParaguayanPennsylvania GermanPeruvianPimaPolishPortuguesePotawatomiPuebloPuerto RicanPuget Sound SalishRomanianRussianSalvadoranSamoanScandinavianScotch-IrishScottishSeminoleSenegaleseSerbianShoshoneSierra LeoneanSiouxSlavicSlovakSloveneSomaliSouth AfricanSouth AmericanSouth American IndianSoviet UnionSpaniardSpanishSpanish AmericanSpanish American IndianSri LankanSubsaharan AfricanSudaneseSwedishSwissSyrianTaiwaneseThaiTlingit-HaidaTohono O'OdhamTonganTrinidadian and TobagonianTsimshianTurkishU.S. Virgin IslanderUgandanUkrainianUruguayanUteVenezuelanVietnameseWelshWest IndianYakamaYaquiYugoslavianYumanYup'ikZimbabwean
Immigration
NonimmigrantsImmigrantsAfghanistanAfricaAlbaniaArgentinaArmeniaAsiaAustraliaAustriaBahamasBangladeshBarbadosBelarusBelgiumBelizeBoliviaBosnia and HerzegovinaBrazilBulgariaBurma/MyanmarCabo VerdeCambodiaCameroonCanadaCaribbeanCentral AmericaChileChinaColombiaCongoCosta RicaCroatiaCubaDenmarkDominicaDominican RepublicEastern AfricaEastern AsiaEastern EuropeEcuadorEgyptEl SalvadorEnglandEritreaEthiopiaEuropeFijiFranceGermanyGhanaGreeceGrenadaGuatemalaGuyanaHaitiHondurasHong KongHungaryIndiaIndonesiaIranIraqIrelandIsraelItalyJamaicaJapanJordanKazakhstanKenyaKoreaKuwaitLaosLatin AmericaLatviaLebanonLiberiaLithuaniaMalaysiaMexicoMicronesiaMiddle AfricaMoldovaMoroccoNepalNetherlandsNicaraguaNigeriaNorth AmericaNorth MacedoniaNorthern AfricaNorthern EuropeNorwayOceaniaPakistanPanamaPeruPhilippinesPolandPortugalRomaniaRussiaSaudi ArabiaScotlandSenegalSerbiaSierra LeoneSingaporeSomaliaSouth AfricaSouth AmericaSouth Central AsiaSouth Eastern AsiaSouthern EuropeSpainSri LankaSt. Vincent and the GrenadinesSudanSwedenSwitzerlandSyriaTaiwanThailandTrinidad and TobagoTurkeyUgandaUkraineUruguayUzbekistanVenezuelaVietnamWest IndiesWestern AfricaWestern AsiaWestern EuropeYemenZaireZimbabweAzores
Disability
Income
Poverty
Unemployment
Labor Participation
Family Structure
Vehicle Availability
Education Level
Disability

Disability Comparison

Immigrants from Czechoslovakia

Immigrants from Kenya

Exceptional
Good
11.2%
DISABILITY
97.4/ 100
METRIC RATING
99th/ 347
METRIC RANK
11.6%
DISABILITY
72.1/ 100
METRIC RATING
151st/ 347
METRIC RANK

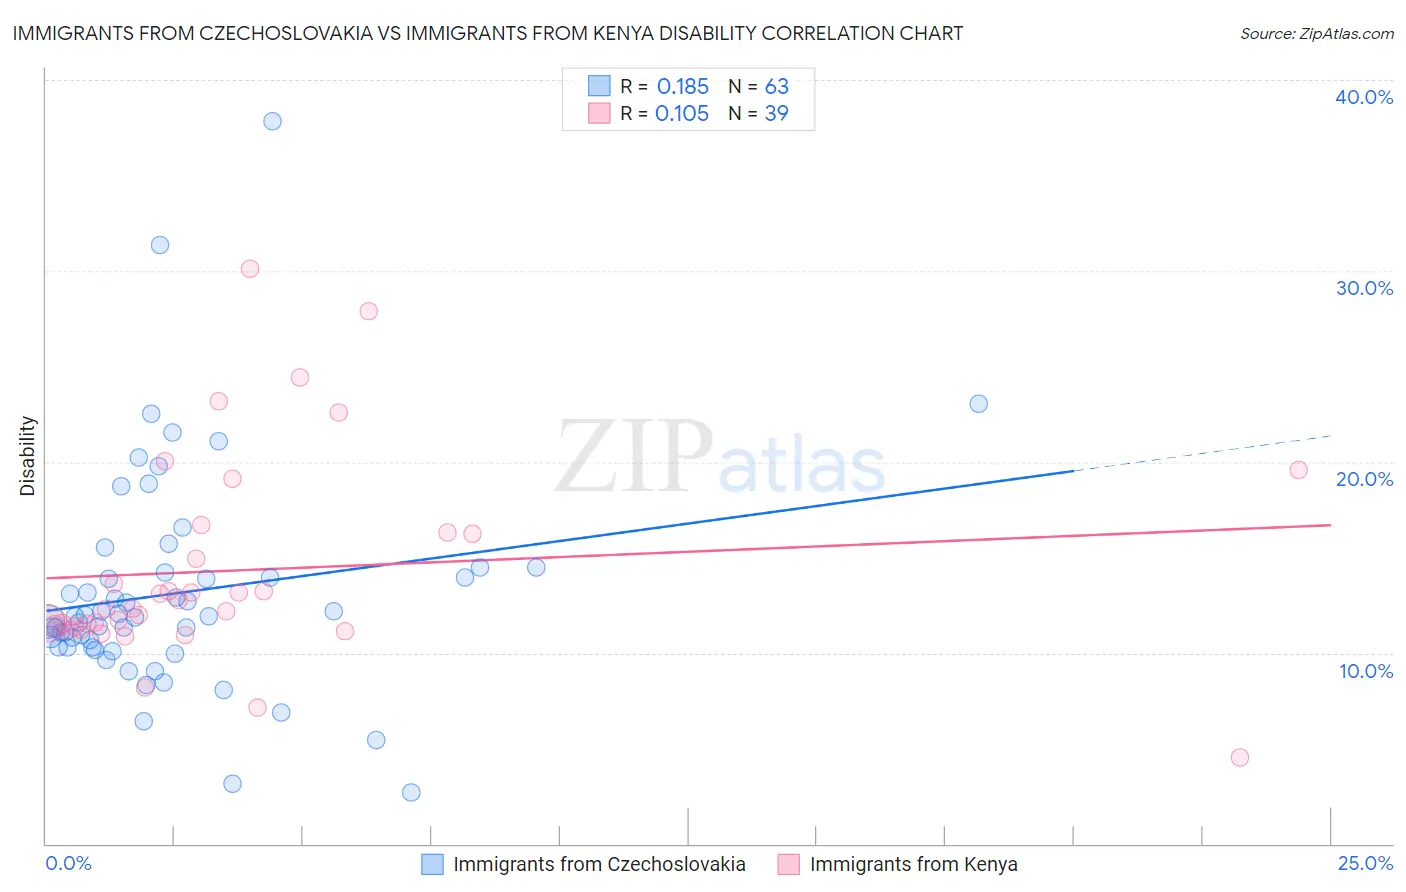
Immigrants from Czechoslovakia vs Immigrants from Kenya Disability Correlation Chart

The statistical analysis conducted on geographies consisting of 195,454,618 people shows a poor positive correlation between the proportion of Immigrants from Czechoslovakia and percentage of population with a disability in the United States with a correlation coefficient (R) of 0.185 and weighted average of 11.2%. Similarly, the statistical analysis conducted on geographies consisting of 218,058,395 people shows a poor positive correlation between the proportion of Immigrants from Kenya and percentage of population with a disability in the United States with a correlation coefficient (R) of 0.105 and weighted average of 11.6%, a difference of 3.1%.
Immigrants from Czechoslovakia vs Immigrants from Kenya Disability

Disability Correlation Summary

MeasurementImmigrants from CzechoslovakiaImmigrants from Kenya
Minimum2.7%4.5%
Maximum37.8%30.1%
Range35.2%25.6%
Mean13.1%14.3%
Median11.9%12.3%
Interquartile 25% (IQ1)10.3%11.4%
Interquartile 75% (IQ3)14.2%16.3%
Interquartile Range (IQR)3.9%4.9%
Standard Deviation (Sample)5.7%5.4%
Standard Deviation (Population)5.7%5.3%

Similar Demographics by Disability

Demographics Similar to Immigrants from Czechoslovakia by Disability

In terms of disability, the demographic groups most similar to Immigrants from Czechoslovakia are Bhutanese (11.2%, a difference of 0.010%), Uruguayan (11.2%, a difference of 0.010%), Immigrants from Zimbabwe (11.2%, a difference of 0.15%), Immigrants from Greece (11.3%, a difference of 0.18%), and Immigrants from Morocco (11.2%, a difference of 0.22%).
DemographicsRating | RankDisability
Ecuadorians
98.0
/100
|
#92
Exceptional
11.2%
Immigrants | Ecuador
98.0
/100
|
#93
Exceptional
11.2%
Immigrants | Morocco
97.8
/100
|
#94
Exceptional
11.2%
Eastern Europeans
97.8
/100
|
#95
Exceptional
11.2%
Immigrants | Zimbabwe
97.7
/100
|
#96
Exceptional
11.2%
Bhutanese
97.4
/100
|
#97
Exceptional
11.2%
Uruguayans
97.4
/100
|
#98
Exceptional
11.2%
Immigrants | Czechoslovakia
97.4
/100
|
#99
Exceptional
11.2%
Immigrants | Greece
96.9
/100
|
#100
Exceptional
11.3%
Immigrants | Nicaragua
96.8
/100
|
#101
Exceptional
11.3%
Immigrants | Eastern Africa
96.7
/100
|
#102
Exceptional
11.3%
Immigrants | Uruguay
96.4
/100
|
#103
Exceptional
11.3%
Immigrants | Immigrants
96.4
/100
|
#104
Exceptional
11.3%
Immigrants | Kazakhstan
96.4
/100
|
#105
Exceptional
11.3%
Immigrants | Eastern Europe
96.3
/100
|
#106
Exceptional
11.3%

Demographics Similar to Immigrants from Kenya by Disability

In terms of disability, the demographic groups most similar to Immigrants from Kenya are Immigrants from Moldova (11.6%, a difference of 0.0%), Romanian (11.6%, a difference of 0.030%), Immigrants from Ghana (11.6%, a difference of 0.050%), Immigrants from Guatemala (11.6%, a difference of 0.050%), and Immigrants from Norway (11.6%, a difference of 0.060%).
DemographicsRating | RankDisability
Australians
82.5
/100
|
#144
Excellent
11.5%
Nigerians
81.3
/100
|
#145
Excellent
11.5%
Immigrants | Hungary
79.0
/100
|
#146
Good
11.5%
Immigrants | Ukraine
77.6
/100
|
#147
Good
11.5%
Sudanese
77.1
/100
|
#148
Good
11.5%
Immigrants | Norway
73.2
/100
|
#149
Good
11.6%
Romanians
72.7
/100
|
#150
Good
11.6%
Immigrants | Kenya
72.1
/100
|
#151
Good
11.6%
Immigrants | Moldova
72.0
/100
|
#152
Good
11.6%
Immigrants | Ghana
71.2
/100
|
#153
Good
11.6%
Immigrants | Guatemala
71.1
/100
|
#154
Good
11.6%
Immigrants | Netherlands
69.8
/100
|
#155
Good
11.6%
Immigrants | Fiji
69.5
/100
|
#156
Good
11.6%
Immigrants | Middle Africa
69.5
/100
|
#157
Good
11.6%
Armenians
65.9
/100
|
#158
Good
11.6%