Immigrants from China vs Immigrants from Costa Rica Ambulatory Disability
COMPARE
Immigrants from China
Immigrants from Costa Rica
Ambulatory Disability
Ambulatory Disability Comparison
Immigrants from China
Immigrants from Costa Rica
5.3%
AMBULATORY DISABILITY
100.0/ 100
METRIC RATING
15th/ 347
METRIC RANK
5.9%
AMBULATORY DISABILITY
89.5/ 100
METRIC RATING
131st/ 347
METRIC RANK
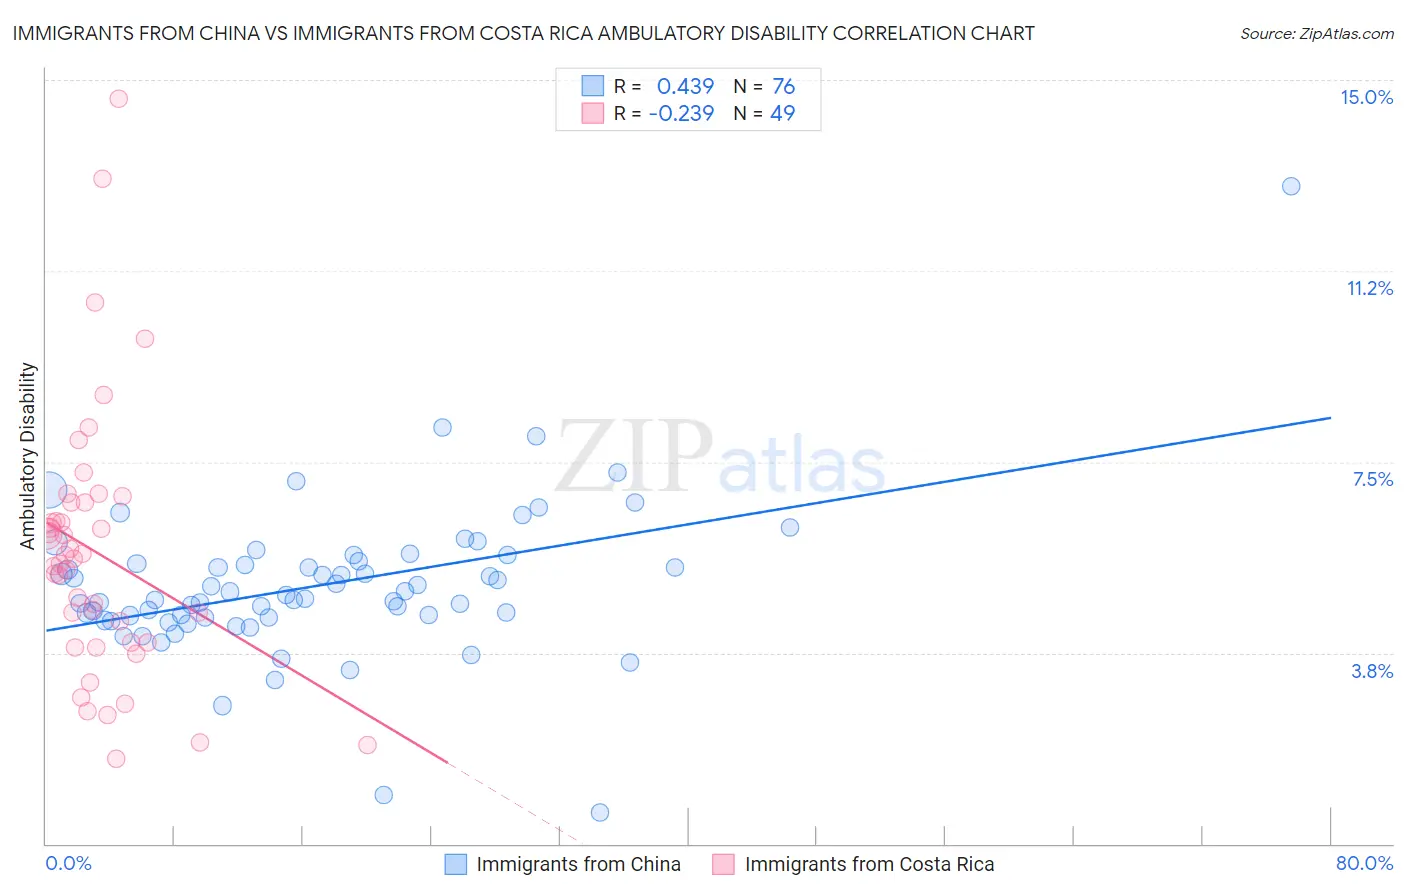
Immigrants from China vs Immigrants from Costa Rica Ambulatory Disability Correlation Chart
The statistical analysis conducted on geographies consisting of 456,848,702 people shows a moderate positive correlation between the proportion of Immigrants from China and percentage of population with ambulatory disability in the United States with a correlation coefficient (R) of 0.439 and weighted average of 5.3%. Similarly, the statistical analysis conducted on geographies consisting of 204,267,937 people shows a weak negative correlation between the proportion of Immigrants from Costa Rica and percentage of population with ambulatory disability in the United States with a correlation coefficient (R) of -0.239 and weighted average of 5.9%, a difference of 11.9%.
Ambulatory Disability Correlation Summary
| Measurement | Immigrants from China | Immigrants from Costa Rica |
| Minimum | 0.61% | 1.7% |
| Maximum | 12.9% | 14.6% |
| Range | 12.3% | 13.0% |
| Mean | 5.1% | 5.7% |
| Median | 4.8% | 5.6% |
| Interquartile 25% (IQ1) | 4.4% | 4.0% |
| Interquartile 75% (IQ3) | 5.5% | 6.7% |
| Interquartile Range (IQR) | 1.1% | 2.8% |
| Standard Deviation (Sample) | 1.5% | 2.6% |
| Standard Deviation (Population) | 1.5% | 2.6% |
Similar Demographics by Ambulatory Disability
Demographics Similar to Immigrants from China by Ambulatory Disability
In terms of ambulatory disability, the demographic groups most similar to Immigrants from China are Immigrants from Eastern Asia (5.3%, a difference of 0.33%), Burmese (5.3%, a difference of 0.48%), Immigrants from Hong Kong (5.3%, a difference of 0.54%), Immigrants from Ethiopia (5.4%, a difference of 0.88%), and Immigrants from Sri Lanka (5.4%, a difference of 0.88%).
| Demographics | Rating | Rank | Ambulatory Disability |
| Immigrants | South Central Asia | 100.0 /100 | #8 | Exceptional 5.1% |
| Iranians | 100.0 /100 | #9 | Exceptional 5.1% |
| Yup'ik | 100.0 /100 | #10 | Exceptional 5.2% |
| Immigrants | Korea | 100.0 /100 | #11 | Exceptional 5.2% |
| Okinawans | 100.0 /100 | #12 | Exceptional 5.3% |
| Burmese | 100.0 /100 | #13 | Exceptional 5.3% |
| Immigrants | Eastern Asia | 100.0 /100 | #14 | Exceptional 5.3% |
| Immigrants | China | 100.0 /100 | #15 | Exceptional 5.3% |
| Immigrants | Hong Kong | 100.0 /100 | #16 | Exceptional 5.3% |
| Immigrants | Ethiopia | 100.0 /100 | #17 | Exceptional 5.4% |
| Immigrants | Sri Lanka | 100.0 /100 | #18 | Exceptional 5.4% |
| Indians (Asian) | 100.0 /100 | #19 | Exceptional 5.4% |
| Ethiopians | 100.0 /100 | #20 | Exceptional 5.4% |
| Immigrants | Kuwait | 100.0 /100 | #21 | Exceptional 5.4% |
| Immigrants | Israel | 100.0 /100 | #22 | Exceptional 5.4% |
Demographics Similar to Immigrants from Costa Rica by Ambulatory Disability
In terms of ambulatory disability, the demographic groups most similar to Immigrants from Costa Rica are Immigrants from Kazakhstan (5.9%, a difference of 0.030%), Immigrants from Norway (5.9%, a difference of 0.14%), Immigrants from Western Asia (5.9%, a difference of 0.17%), Immigrants from Nigeria (5.9%, a difference of 0.21%), and Immigrants from Europe (6.0%, a difference of 0.24%).
| Demographics | Rating | Rank | Ambulatory Disability |
| Immigrants | Middle Africa | 92.2 /100 | #124 | Exceptional 5.9% |
| Koreans | 91.6 /100 | #125 | Exceptional 5.9% |
| Arabs | 91.5 /100 | #126 | Exceptional 5.9% |
| Immigrants | Nigeria | 90.9 /100 | #127 | Exceptional 5.9% |
| Immigrants | Western Asia | 90.7 /100 | #128 | Exceptional 5.9% |
| Immigrants | Norway | 90.5 /100 | #129 | Exceptional 5.9% |
| Immigrants | Kazakhstan | 89.7 /100 | #130 | Excellent 5.9% |
| Immigrants | Costa Rica | 89.5 /100 | #131 | Excellent 5.9% |
| Immigrants | Europe | 87.8 /100 | #132 | Excellent 6.0% |
| Immigrants | Immigrants | 86.9 /100 | #133 | Excellent 6.0% |
| Ute | 86.6 /100 | #134 | Excellent 6.0% |
| Immigrants | Italy | 85.0 /100 | #135 | Excellent 6.0% |
| Immigrants | North Macedonia | 84.1 /100 | #136 | Excellent 6.0% |
| Immigrants | Syria | 84.1 /100 | #137 | Excellent 6.0% |
| Immigrants | Hungary | 83.9 /100 | #138 | Excellent 6.0% |