Immigrants from Burma/Myanmar vs Finnish Female Disability
COMPARE
Immigrants from Burma/Myanmar
Finnish
Female Disability
Female Disability Comparison
Immigrants from Burma/Myanmar
Finns
12.4%
FEMALE DISABILITY
13.3/ 100
METRIC RATING
216th/ 347
METRIC RANK
12.8%
FEMALE DISABILITY
0.4/ 100
METRIC RATING
266th/ 347
METRIC RANK
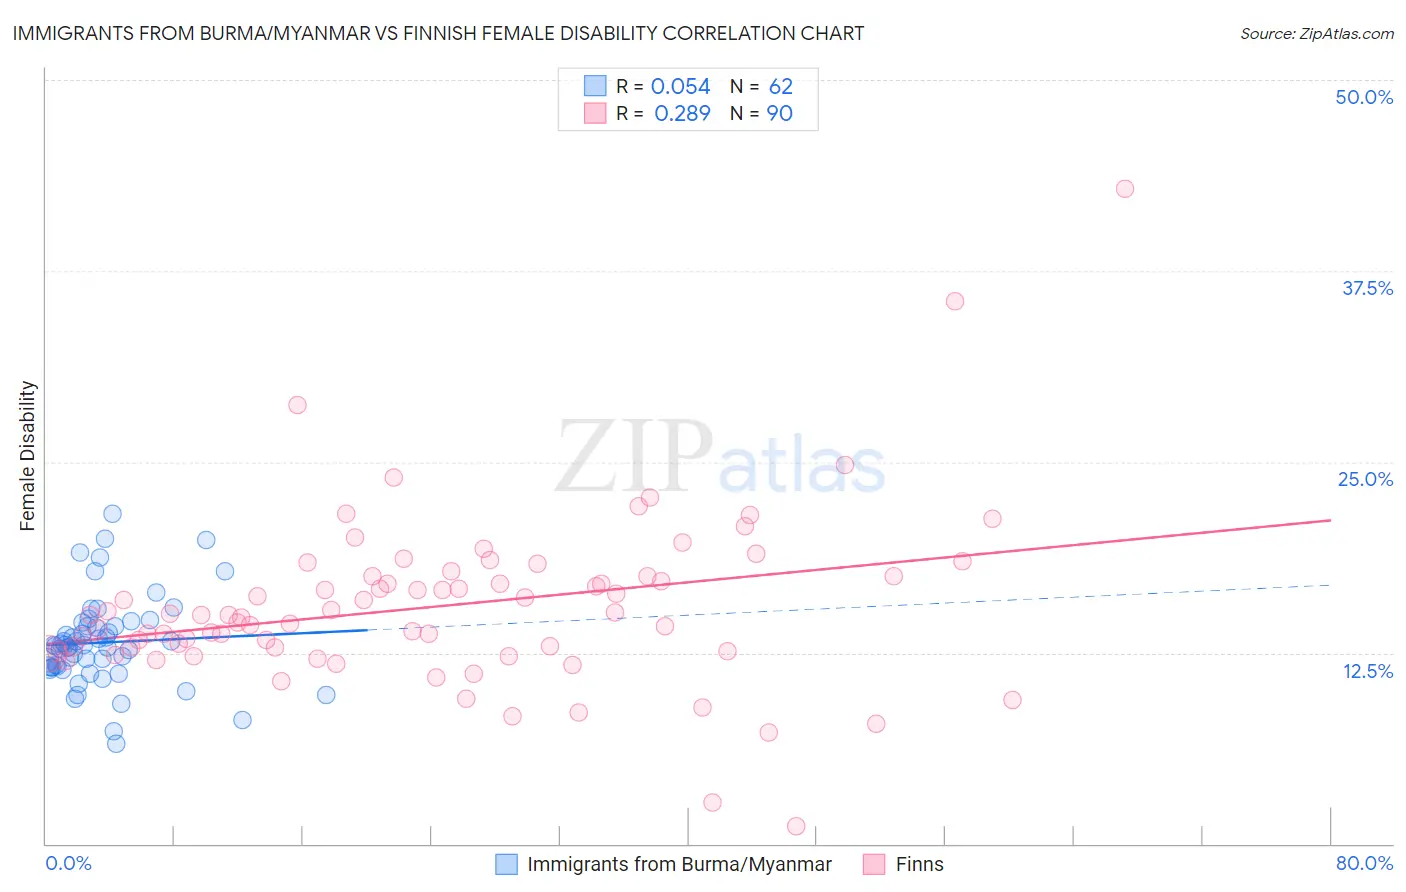
Immigrants from Burma/Myanmar vs Finnish Female Disability Correlation Chart
The statistical analysis conducted on geographies consisting of 172,344,349 people shows a slight positive correlation between the proportion of Immigrants from Burma/Myanmar and percentage of females with a disability in the United States with a correlation coefficient (R) of 0.054 and weighted average of 12.4%. Similarly, the statistical analysis conducted on geographies consisting of 404,612,195 people shows a weak positive correlation between the proportion of Finns and percentage of females with a disability in the United States with a correlation coefficient (R) of 0.289 and weighted average of 12.8%, a difference of 3.3%.
Female Disability Correlation Summary
| Measurement | Immigrants from Burma/Myanmar | Finnish |
| Minimum | 6.6% | 1.2% |
| Maximum | 21.6% | 42.9% |
| Range | 15.0% | 41.7% |
| Mean | 13.2% | 15.5% |
| Median | 12.9% | 15.0% |
| Interquartile 25% (IQ1) | 11.6% | 12.6% |
| Interquartile 75% (IQ3) | 14.3% | 17.5% |
| Interquartile Range (IQR) | 2.7% | 5.0% |
| Standard Deviation (Sample) | 2.9% | 5.6% |
| Standard Deviation (Population) | 2.9% | 5.6% |
Similar Demographics by Female Disability
Demographics Similar to Immigrants from Burma/Myanmar by Female Disability
In terms of female disability, the demographic groups most similar to Immigrants from Burma/Myanmar are Panamanian (12.4%, a difference of 0.010%), Samoan (12.4%, a difference of 0.010%), British (12.4%, a difference of 0.050%), Immigrants from Bahamas (12.4%, a difference of 0.070%), and Immigrants from Thailand (12.4%, a difference of 0.090%).
| Demographics | Rating | Rank | Female Disability |
| Mexicans | 15.7 /100 | #209 | Poor 12.4% |
| Swiss | 14.9 /100 | #210 | Poor 12.4% |
| Immigrants | Bosnia and Herzegovina | 14.8 /100 | #211 | Poor 12.4% |
| Ute | 14.7 /100 | #212 | Poor 12.4% |
| Immigrants | Thailand | 14.5 /100 | #213 | Poor 12.4% |
| Panamanians | 13.5 /100 | #214 | Poor 12.4% |
| Samoans | 13.4 /100 | #215 | Poor 12.4% |
| Immigrants | Burma/Myanmar | 13.3 /100 | #216 | Poor 12.4% |
| British | 12.7 /100 | #217 | Poor 12.4% |
| Immigrants | Bahamas | 12.5 /100 | #218 | Poor 12.4% |
| Europeans | 12.1 /100 | #219 | Poor 12.4% |
| Bahamians | 11.1 /100 | #220 | Poor 12.4% |
| Native Hawaiians | 10.8 /100 | #221 | Poor 12.4% |
| Italians | 10.7 /100 | #222 | Poor 12.4% |
| Guamanians/Chamorros | 9.5 /100 | #223 | Tragic 12.5% |
Demographics Similar to Finns by Female Disability
In terms of female disability, the demographic groups most similar to Finns are Senegalese (12.8%, a difference of 0.020%), Immigrants from Laos (12.8%, a difference of 0.040%), Indonesian (12.8%, a difference of 0.10%), West Indian (12.8%, a difference of 0.12%), and Immigrants from Liberia (12.9%, a difference of 0.28%).
| Demographics | Rating | Rank | Female Disability |
| Immigrants | Armenia | 1.0 /100 | #259 | Tragic 12.7% |
| Sub-Saharan Africans | 1.0 /100 | #260 | Tragic 12.7% |
| Bermudans | 1.0 /100 | #261 | Tragic 12.7% |
| Czechoslovakians | 0.9 /100 | #262 | Tragic 12.7% |
| Spaniards | 0.7 /100 | #263 | Tragic 12.8% |
| Alaska Natives | 0.6 /100 | #264 | Tragic 12.8% |
| West Indians | 0.5 /100 | #265 | Tragic 12.8% |
| Finns | 0.4 /100 | #266 | Tragic 12.8% |
| Senegalese | 0.4 /100 | #267 | Tragic 12.8% |
| Immigrants | Laos | 0.4 /100 | #268 | Tragic 12.8% |
| Indonesians | 0.4 /100 | #269 | Tragic 12.8% |
| Immigrants | Liberia | 0.3 /100 | #270 | Tragic 12.9% |
| Dutch | 0.2 /100 | #271 | Tragic 12.9% |
| Germans | 0.1 /100 | #272 | Tragic 12.9% |
| Sioux | 0.1 /100 | #273 | Tragic 12.9% |