Immigrants from Barbados vs Hungarian Female Disability
COMPARE
Immigrants from Barbados
Hungarian
Female Disability
Female Disability Comparison
Immigrants from Barbados
Hungarians
12.3%
FEMALE DISABILITY
21.1/ 100
METRIC RATING
203rd/ 347
METRIC RANK
12.5%
FEMALE DISABILITY
7.2/ 100
METRIC RATING
229th/ 347
METRIC RANK
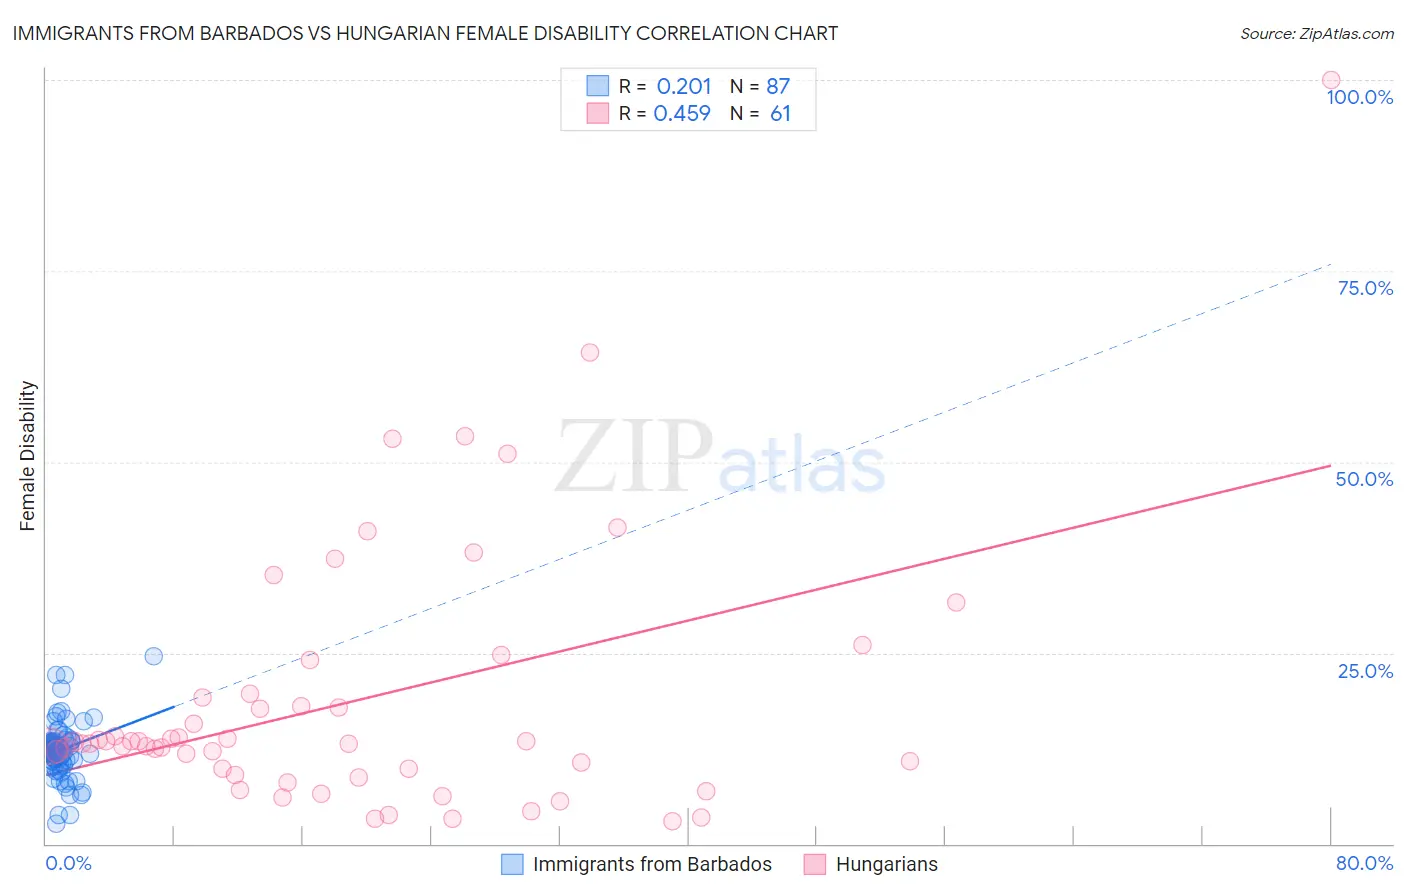
Immigrants from Barbados vs Hungarian Female Disability Correlation Chart
The statistical analysis conducted on geographies consisting of 112,784,400 people shows a weak positive correlation between the proportion of Immigrants from Barbados and percentage of females with a disability in the United States with a correlation coefficient (R) of 0.201 and weighted average of 12.3%. Similarly, the statistical analysis conducted on geographies consisting of 486,134,772 people shows a moderate positive correlation between the proportion of Hungarians and percentage of females with a disability in the United States with a correlation coefficient (R) of 0.459 and weighted average of 12.5%, a difference of 1.1%.
Female Disability Correlation Summary
| Measurement | Immigrants from Barbados | Hungarian |
| Minimum | 2.7% | 2.9% |
| Maximum | 24.6% | 100.0% |
| Range | 21.9% | 97.1% |
| Mean | 12.2% | 18.7% |
| Median | 12.4% | 13.1% |
| Interquartile 25% (IQ1) | 10.9% | 9.4% |
| Interquartile 75% (IQ3) | 13.3% | 19.4% |
| Interquartile Range (IQR) | 2.4% | 10.0% |
| Standard Deviation (Sample) | 3.5% | 17.3% |
| Standard Deviation (Population) | 3.5% | 17.2% |
Similar Demographics by Female Disability
Demographics Similar to Immigrants from Barbados by Female Disability
In terms of female disability, the demographic groups most similar to Immigrants from Barbados are Somali (12.3%, a difference of 0.020%), Immigrants from Zaire (12.3%, a difference of 0.020%), Immigrants from Grenada (12.4%, a difference of 0.040%), Chinese (12.3%, a difference of 0.050%), and Immigrants from Cuba (12.4%, a difference of 0.050%).
| Demographics | Rating | Rank | Female Disability |
| Immigrants | Panama | 25.5 /100 | #196 | Fair 12.3% |
| Hondurans | 25.4 /100 | #197 | Fair 12.3% |
| Mexican American Indians | 24.9 /100 | #198 | Fair 12.3% |
| Immigrants | Trinidad and Tobago | 24.7 /100 | #199 | Fair 12.3% |
| Trinidadians and Tobagonians | 22.4 /100 | #200 | Fair 12.3% |
| Chinese | 22.1 /100 | #201 | Fair 12.3% |
| Somalis | 21.5 /100 | #202 | Fair 12.3% |
| Immigrants | Barbados | 21.1 /100 | #203 | Fair 12.3% |
| Immigrants | Zaire | 20.9 /100 | #204 | Fair 12.3% |
| Immigrants | Grenada | 20.5 /100 | #205 | Fair 12.4% |
| Immigrants | Cuba | 20.2 /100 | #206 | Fair 12.4% |
| Croatians | 20.2 /100 | #207 | Fair 12.4% |
| Basques | 17.5 /100 | #208 | Poor 12.4% |
| Mexicans | 15.7 /100 | #209 | Poor 12.4% |
| Swiss | 14.9 /100 | #210 | Poor 12.4% |
Demographics Similar to Hungarians by Female Disability
In terms of female disability, the demographic groups most similar to Hungarians are Immigrants from Belize (12.5%, a difference of 0.030%), Immigrants from Cambodia (12.5%, a difference of 0.070%), Assyrian/Chaldean/Syriac (12.5%, a difference of 0.10%), Hispanic or Latino (12.5%, a difference of 0.11%), and Belgian (12.5%, a difference of 0.11%).
| Demographics | Rating | Rank | Female Disability |
| Italians | 10.7 /100 | #222 | Poor 12.4% |
| Guamanians/Chamorros | 9.5 /100 | #223 | Tragic 12.5% |
| Belizeans | 9.3 /100 | #224 | Tragic 12.5% |
| Poles | 8.4 /100 | #225 | Tragic 12.5% |
| Hispanics or Latinos | 8.0 /100 | #226 | Tragic 12.5% |
| Assyrians/Chaldeans/Syriacs | 8.0 /100 | #227 | Tragic 12.5% |
| Immigrants | Cambodia | 7.8 /100 | #228 | Tragic 12.5% |
| Hungarians | 7.2 /100 | #229 | Tragic 12.5% |
| Immigrants | Belize | 7.0 /100 | #230 | Tragic 12.5% |
| Belgians | 6.5 /100 | #231 | Tragic 12.5% |
| Immigrants | Somalia | 5.9 /100 | #232 | Tragic 12.5% |
| Immigrants | Iraq | 5.3 /100 | #233 | Tragic 12.5% |
| Scandinavians | 5.3 /100 | #234 | Tragic 12.5% |
| Malaysians | 5.0 /100 | #235 | Tragic 12.5% |
| Immigrants | West Indies | 4.4 /100 | #236 | Tragic 12.6% |