Puerto Rican vs Immigrants from Syria Vision Disability
COMPARE
Puerto Rican
Immigrants from Syria
Vision Disability
Vision Disability Comparison
Puerto Ricans
Immigrants from Syria
3.9%
VISION DISABILITY
0.0/ 100
METRIC RATING
347th/ 347
METRIC RANK
2.1%
VISION DISABILITY
96.2/ 100
METRIC RATING
92nd/ 347
METRIC RANK
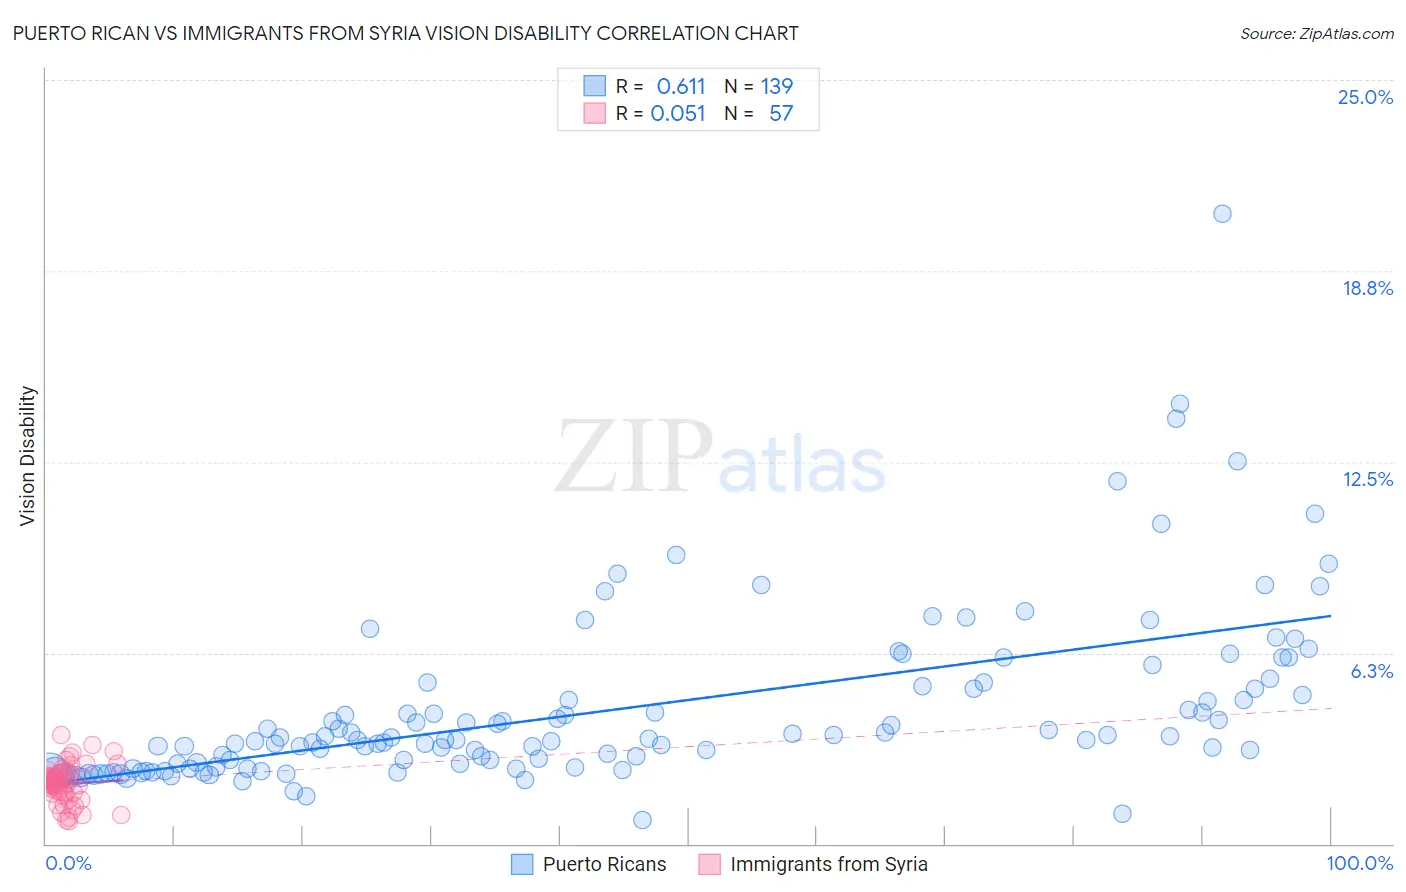
Puerto Rican vs Immigrants from Syria Vision Disability Correlation Chart
The statistical analysis conducted on geographies consisting of 527,298,658 people shows a significant positive correlation between the proportion of Puerto Ricans and percentage of population with vision disability in the United States with a correlation coefficient (R) of 0.611 and weighted average of 3.9%. Similarly, the statistical analysis conducted on geographies consisting of 174,077,138 people shows a slight positive correlation between the proportion of Immigrants from Syria and percentage of population with vision disability in the United States with a correlation coefficient (R) of 0.051 and weighted average of 2.1%, a difference of 88.6%.
Vision Disability Correlation Summary
| Measurement | Puerto Rican | Immigrants from Syria |
| Minimum | 0.78% | 0.73% |
| Maximum | 20.6% | 3.6% |
| Range | 19.8% | 2.8% |
| Mean | 4.4% | 2.0% |
| Median | 3.4% | 2.0% |
| Interquartile 25% (IQ1) | 2.5% | 1.6% |
| Interquartile 75% (IQ3) | 5.1% | 2.3% |
| Interquartile Range (IQR) | 2.6% | 0.65% |
| Standard Deviation (Sample) | 2.9% | 0.61% |
| Standard Deviation (Population) | 2.9% | 0.61% |
Similar Demographics by Vision Disability
Demographics Similar to Puerto Ricans by Vision Disability
In terms of vision disability, the demographic groups most similar to Puerto Ricans are Houma (3.4%, a difference of 12.7%), Lumbee (3.4%, a difference of 14.5%), Pueblo (3.3%, a difference of 16.4%), Pima (3.3%, a difference of 16.4%), and Choctaw (3.3%, a difference of 17.6%).
| Demographics | Rating | Rank | Vision Disability |
| Cajuns | 0.0 /100 | #333 | Tragic 3.1% |
| Cheyenne | 0.0 /100 | #334 | Tragic 3.1% |
| Navajo | 0.0 /100 | #335 | Tragic 3.1% |
| Alaskan Athabascans | 0.0 /100 | #336 | Tragic 3.1% |
| Dutch West Indians | 0.0 /100 | #337 | Tragic 3.2% |
| Chickasaw | 0.0 /100 | #338 | Tragic 3.2% |
| Tsimshian | 0.0 /100 | #339 | Tragic 3.2% |
| Creek | 0.0 /100 | #340 | Tragic 3.2% |
| Kiowa | 0.0 /100 | #341 | Tragic 3.3% |
| Choctaw | 0.0 /100 | #342 | Tragic 3.3% |
| Pima | 0.0 /100 | #343 | Tragic 3.3% |
| Pueblo | 0.0 /100 | #344 | Tragic 3.3% |
| Lumbee | 0.0 /100 | #345 | Tragic 3.4% |
| Houma | 0.0 /100 | #346 | Tragic 3.4% |
| Puerto Ricans | 0.0 /100 | #347 | Tragic 3.9% |
Demographics Similar to Immigrants from Syria by Vision Disability
In terms of vision disability, the demographic groups most similar to Immigrants from Syria are Immigrants from Somalia (2.1%, a difference of 0.020%), Immigrants from Europe (2.1%, a difference of 0.050%), Immigrants from Croatia (2.1%, a difference of 0.070%), Australian (2.1%, a difference of 0.14%), and Romanian (2.1%, a difference of 0.20%).
| Demographics | Rating | Rank | Vision Disability |
| Chinese | 97.2 /100 | #85 | Exceptional 2.0% |
| Immigrants | Moldova | 97.2 /100 | #86 | Exceptional 2.0% |
| Immigrants | Switzerland | 97.0 /100 | #87 | Exceptional 2.0% |
| Norwegians | 97.0 /100 | #88 | Exceptional 2.0% |
| Immigrants | Eastern Africa | 97.0 /100 | #89 | Exceptional 2.0% |
| Immigrants | Lebanon | 96.7 /100 | #90 | Exceptional 2.1% |
| Immigrants | Somalia | 96.2 /100 | #91 | Exceptional 2.1% |
| Immigrants | Syria | 96.2 /100 | #92 | Exceptional 2.1% |
| Immigrants | Europe | 96.1 /100 | #93 | Exceptional 2.1% |
| Immigrants | Croatia | 96.0 /100 | #94 | Exceptional 2.1% |
| Australians | 95.9 /100 | #95 | Exceptional 2.1% |
| Romanians | 95.7 /100 | #96 | Exceptional 2.1% |
| Immigrants | Afghanistan | 95.6 /100 | #97 | Exceptional 2.1% |
| Immigrants | South Africa | 95.4 /100 | #98 | Exceptional 2.1% |
| Estonians | 95.3 /100 | #99 | Exceptional 2.1% |