Immigrants from Asia vs Bermudan Vision Disability
COMPARE
Immigrants from Asia
Bermudan
Vision Disability
Vision Disability Comparison
Immigrants from Asia
Bermudans
1.9%
VISION DISABILITY
99.9/ 100
METRIC RATING
23rd/ 347
METRIC RANK
2.2%
VISION DISABILITY
9.0/ 100
METRIC RATING
212th/ 347
METRIC RANK
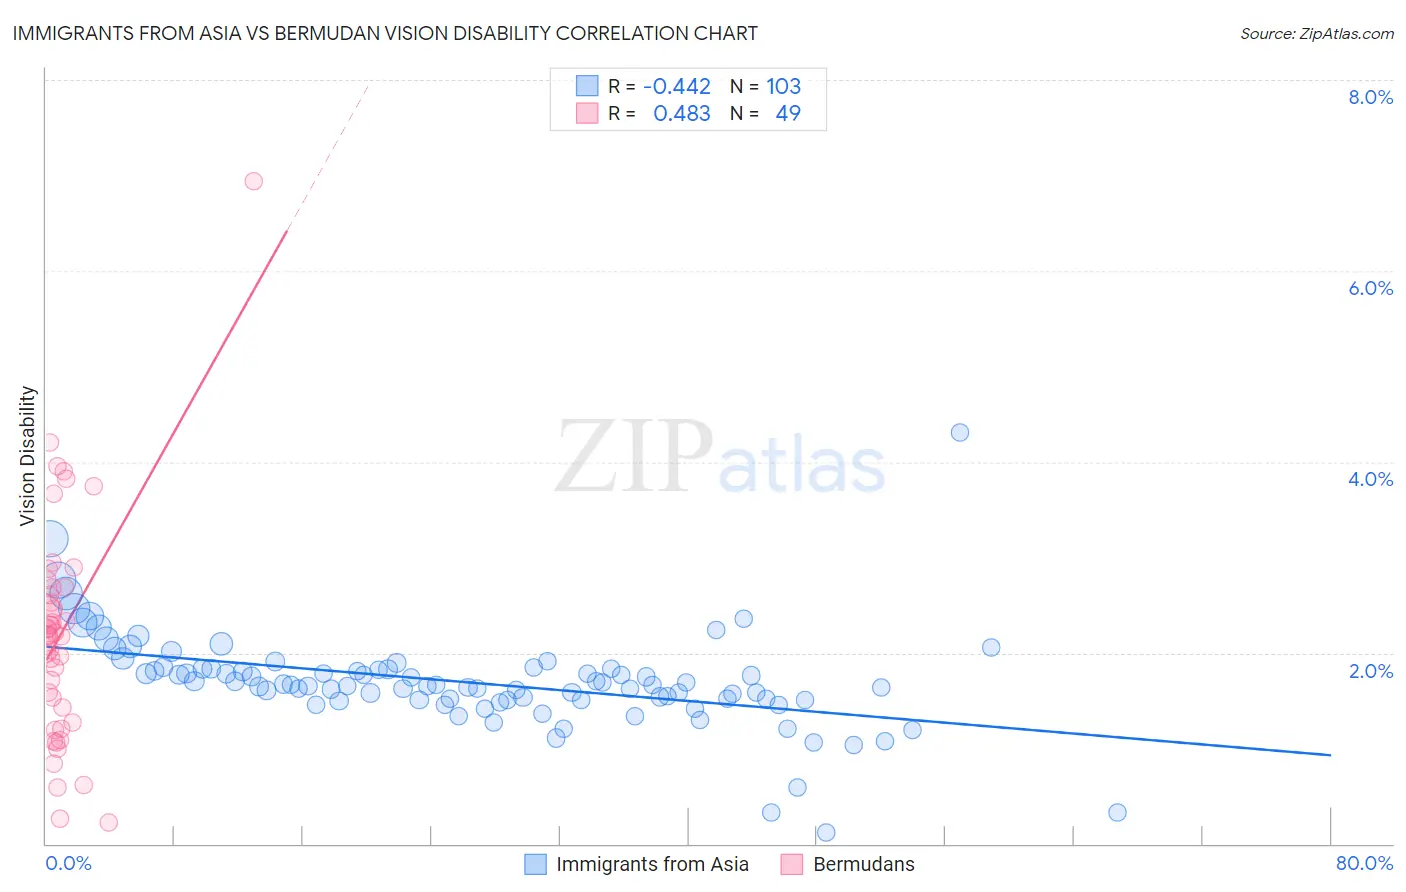
Immigrants from Asia vs Bermudan Vision Disability Correlation Chart
The statistical analysis conducted on geographies consisting of 547,864,164 people shows a moderate negative correlation between the proportion of Immigrants from Asia and percentage of population with vision disability in the United States with a correlation coefficient (R) of -0.442 and weighted average of 1.9%. Similarly, the statistical analysis conducted on geographies consisting of 55,718,331 people shows a moderate positive correlation between the proportion of Bermudans and percentage of population with vision disability in the United States with a correlation coefficient (R) of 0.483 and weighted average of 2.2%, a difference of 17.1%.
Vision Disability Correlation Summary
| Measurement | Immigrants from Asia | Bermudan |
| Minimum | 0.11% | 0.22% |
| Maximum | 4.3% | 6.9% |
| Range | 4.2% | 6.7% |
| Mean | 1.7% | 2.2% |
| Median | 1.7% | 2.2% |
| Interquartile 25% (IQ1) | 1.5% | 1.3% |
| Interquartile 75% (IQ3) | 1.8% | 2.7% |
| Interquartile Range (IQR) | 0.32% | 1.3% |
| Standard Deviation (Sample) | 0.51% | 1.2% |
| Standard Deviation (Population) | 0.51% | 1.2% |
Similar Demographics by Vision Disability
Demographics Similar to Immigrants from Asia by Vision Disability
In terms of vision disability, the demographic groups most similar to Immigrants from Asia are Immigrants from Lithuania (1.9%, a difference of 0.12%), Bulgarian (1.9%, a difference of 0.16%), Immigrants from Japan (1.9%, a difference of 0.20%), Immigrants from Pakistan (1.9%, a difference of 0.54%), and Taiwanese (1.9%, a difference of 0.54%).
| Demographics | Rating | Rank | Vision Disability |
| Indians (Asian) | 100.0 /100 | #16 | Exceptional 1.8% |
| Burmese | 100.0 /100 | #17 | Exceptional 1.8% |
| Bolivians | 100.0 /100 | #18 | Exceptional 1.9% |
| Immigrants | Sri Lanka | 100.0 /100 | #19 | Exceptional 1.9% |
| Asians | 100.0 /100 | #20 | Exceptional 1.9% |
| Turks | 100.0 /100 | #21 | Exceptional 1.9% |
| Immigrants | Pakistan | 100.0 /100 | #22 | Exceptional 1.9% |
| Immigrants | Asia | 99.9 /100 | #23 | Exceptional 1.9% |
| Immigrants | Lithuania | 99.9 /100 | #24 | Exceptional 1.9% |
| Bulgarians | 99.9 /100 | #25 | Exceptional 1.9% |
| Immigrants | Japan | 99.9 /100 | #26 | Exceptional 1.9% |
| Taiwanese | 99.9 /100 | #27 | Exceptional 1.9% |
| Immigrants | Malaysia | 99.9 /100 | #28 | Exceptional 1.9% |
| Egyptians | 99.9 /100 | #29 | Exceptional 1.9% |
| Immigrants | Nepal | 99.9 /100 | #30 | Exceptional 1.9% |
Demographics Similar to Bermudans by Vision Disability
In terms of vision disability, the demographic groups most similar to Bermudans are Immigrants from Ghana (2.2%, a difference of 0.010%), Indonesian (2.2%, a difference of 0.090%), Trinidadian and Tobagonian (2.2%, a difference of 0.14%), Nigerian (2.3%, a difference of 0.35%), and Immigrants from Uruguay (2.2%, a difference of 0.43%).
| Demographics | Rating | Rank | Vision Disability |
| Samoans | 15.7 /100 | #205 | Poor 2.2% |
| Pennsylvania Germans | 14.5 /100 | #206 | Poor 2.2% |
| Immigrants | Nigeria | 13.5 /100 | #207 | Poor 2.2% |
| Germans | 13.4 /100 | #208 | Poor 2.2% |
| Immigrants | Brazil | 13.1 /100 | #209 | Poor 2.2% |
| Immigrants | Uruguay | 11.5 /100 | #210 | Poor 2.2% |
| Indonesians | 9.5 /100 | #211 | Tragic 2.2% |
| Bermudans | 9.0 /100 | #212 | Tragic 2.2% |
| Immigrants | Ghana | 8.9 /100 | #213 | Tragic 2.2% |
| Trinidadians and Tobagonians | 8.2 /100 | #214 | Tragic 2.2% |
| Nigerians | 7.2 /100 | #215 | Tragic 2.3% |
| Immigrants | Trinidad and Tobago | 6.1 /100 | #216 | Tragic 2.3% |
| Barbadians | 5.1 /100 | #217 | Tragic 2.3% |
| Portuguese | 4.9 /100 | #218 | Tragic 2.3% |
| Ecuadorians | 4.6 /100 | #219 | Tragic 2.3% |