Immigrants from Armenia vs Iroquois Disability
COMPARE
Immigrants from Armenia
Iroquois
Disability
Disability Comparison
Immigrants from Armenia
Iroquois
11.7%
DISABILITY
41.9/ 100
METRIC RATING
179th/ 347
METRIC RANK
13.8%
DISABILITY
0.0/ 100
METRIC RATING
319th/ 347
METRIC RANK
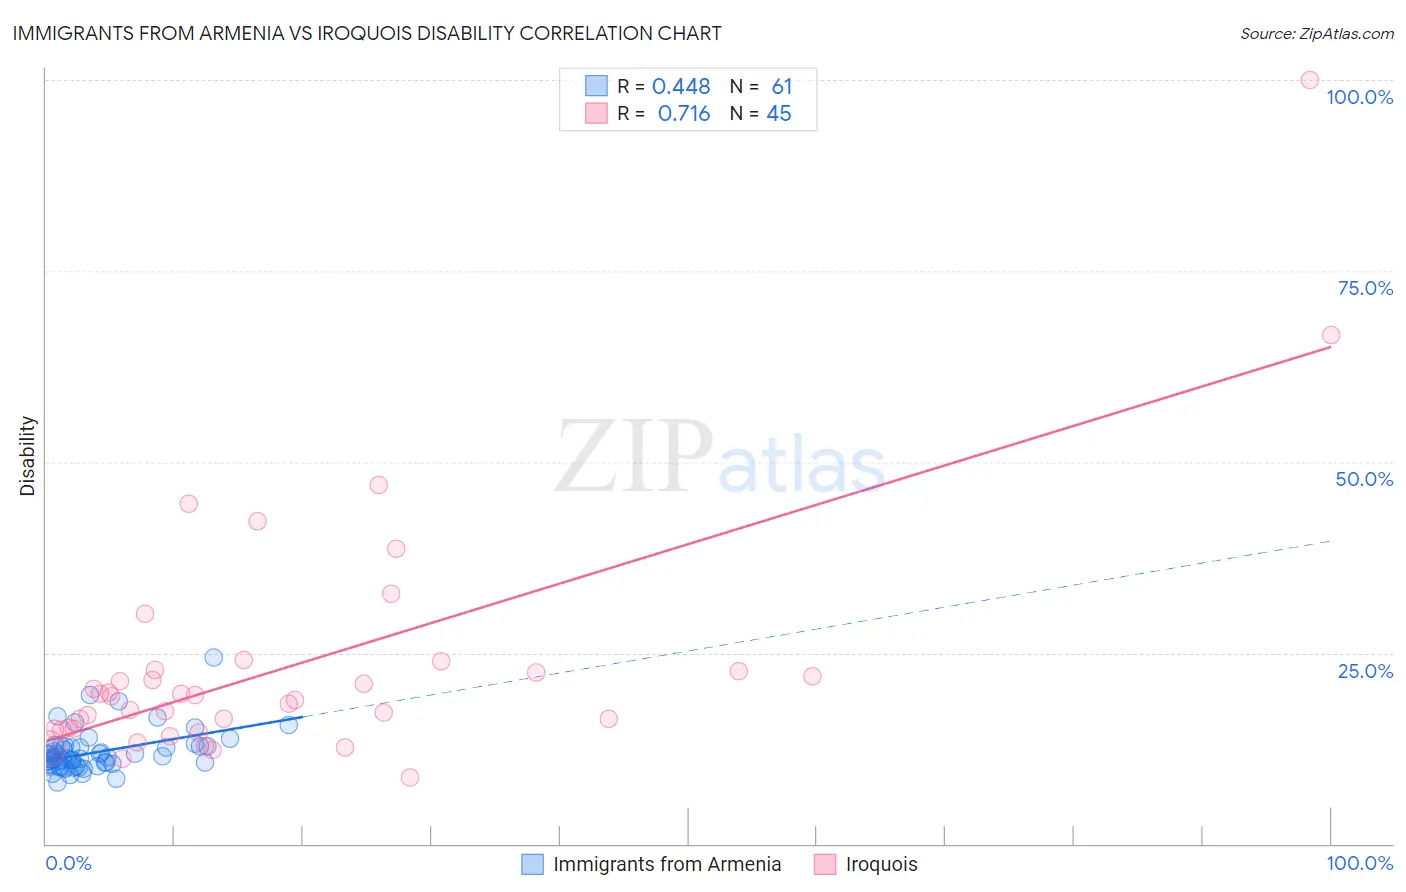
Immigrants from Armenia vs Iroquois Disability Correlation Chart
The statistical analysis conducted on geographies consisting of 97,710,593 people shows a moderate positive correlation between the proportion of Immigrants from Armenia and percentage of population with a disability in the United States with a correlation coefficient (R) of 0.448 and weighted average of 11.7%. Similarly, the statistical analysis conducted on geographies consisting of 207,277,318 people shows a strong positive correlation between the proportion of Iroquois and percentage of population with a disability in the United States with a correlation coefficient (R) of 0.716 and weighted average of 13.8%, a difference of 17.6%.
Disability Correlation Summary
| Measurement | Immigrants from Armenia | Iroquois |
| Minimum | 7.9% | 8.7% |
| Maximum | 24.5% | 100.0% |
| Range | 16.5% | 91.3% |
| Mean | 12.0% | 23.3% |
| Median | 11.2% | 19.3% |
| Interquartile 25% (IQ1) | 10.3% | 15.0% |
| Interquartile 75% (IQ3) | 12.7% | 22.7% |
| Interquartile Range (IQR) | 2.5% | 7.7% |
| Standard Deviation (Sample) | 2.8% | 16.0% |
| Standard Deviation (Population) | 2.8% | 15.8% |
Similar Demographics by Disability
Demographics Similar to Immigrants from Armenia by Disability
In terms of disability, the demographic groups most similar to Immigrants from Armenia are Greek (11.7%, a difference of 0.19%), Immigrants from Honduras (11.8%, a difference of 0.19%), Immigrants from Central America (11.7%, a difference of 0.21%), Immigrants from Western Africa (11.7%, a difference of 0.25%), and Haitian (11.7%, a difference of 0.30%).
| Demographics | Rating | Rank | Disability |
| Trinidadians and Tobagonians | 52.7 /100 | #172 | Average 11.7% |
| Maltese | 50.6 /100 | #173 | Average 11.7% |
| Albanians | 50.0 /100 | #174 | Average 11.7% |
| Haitians | 48.6 /100 | #175 | Average 11.7% |
| Immigrants | Western Africa | 47.5 /100 | #176 | Average 11.7% |
| Immigrants | Central America | 46.6 /100 | #177 | Average 11.7% |
| Greeks | 46.2 /100 | #178 | Average 11.7% |
| Immigrants | Armenia | 41.9 /100 | #179 | Average 11.7% |
| Immigrants | Honduras | 37.8 /100 | #180 | Fair 11.8% |
| Immigrants | Oceania | 34.3 /100 | #181 | Fair 11.8% |
| Icelanders | 34.0 /100 | #182 | Fair 11.8% |
| Hondurans | 31.2 /100 | #183 | Fair 11.8% |
| Iraqis | 30.0 /100 | #184 | Fair 11.8% |
| Immigrants | Burma/Myanmar | 28.5 /100 | #185 | Fair 11.8% |
| Immigrants | Scotland | 28.2 /100 | #186 | Fair 11.8% |
Demographics Similar to Iroquois by Disability
In terms of disability, the demographic groups most similar to Iroquois are Menominee (13.8%, a difference of 0.21%), Apache (13.9%, a difference of 0.29%), Paiute (13.9%, a difference of 0.42%), Pima (13.7%, a difference of 0.79%), and Immigrants from Cabo Verde (13.7%, a difference of 0.79%).
| Demographics | Rating | Rank | Disability |
| Spanish Americans | 0.0 /100 | #312 | Tragic 13.6% |
| Cree | 0.0 /100 | #313 | Tragic 13.7% |
| Blacks/African Americans | 0.0 /100 | #314 | Tragic 13.7% |
| Puget Sound Salish | 0.0 /100 | #315 | Tragic 13.7% |
| Pima | 0.0 /100 | #316 | Tragic 13.7% |
| Immigrants | Cabo Verde | 0.0 /100 | #317 | Tragic 13.7% |
| Menominee | 0.0 /100 | #318 | Tragic 13.8% |
| Iroquois | 0.0 /100 | #319 | Tragic 13.8% |
| Apache | 0.0 /100 | #320 | Tragic 13.9% |
| Paiute | 0.0 /100 | #321 | Tragic 13.9% |
| Americans | 0.0 /100 | #322 | Tragic 13.9% |
| Comanche | 0.0 /100 | #323 | Tragic 14.1% |
| Chippewa | 0.0 /100 | #324 | Tragic 14.1% |
| Natives/Alaskans | 0.0 /100 | #325 | Tragic 14.2% |
| Osage | 0.0 /100 | #326 | Tragic 14.2% |