Icelander vs Immigrants from Mexico Ambulatory Disability
COMPARE
Icelander
Immigrants from Mexico
Ambulatory Disability
Ambulatory Disability Comparison
Icelanders
Immigrants from Mexico
5.9%
AMBULATORY DISABILITY
92.6/ 100
METRIC RATING
122nd/ 347
METRIC RANK
6.3%
AMBULATORY DISABILITY
11.0/ 100
METRIC RATING
214th/ 347
METRIC RANK
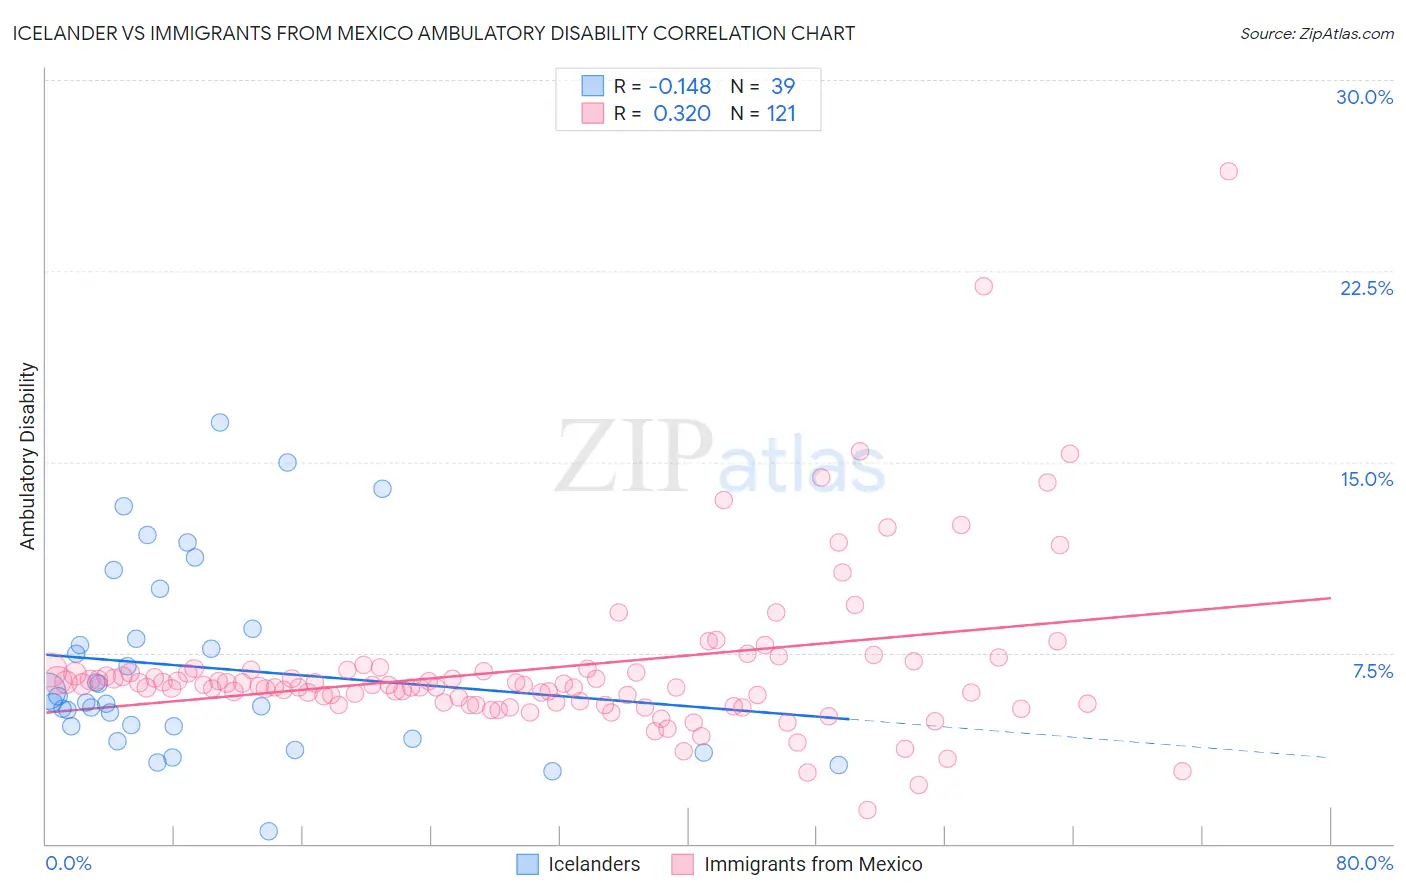
Icelander vs Immigrants from Mexico Ambulatory Disability Correlation Chart
The statistical analysis conducted on geographies consisting of 159,642,692 people shows a poor negative correlation between the proportion of Icelanders and percentage of population with ambulatory disability in the United States with a correlation coefficient (R) of -0.148 and weighted average of 5.9%. Similarly, the statistical analysis conducted on geographies consisting of 513,370,670 people shows a mild positive correlation between the proportion of Immigrants from Mexico and percentage of population with ambulatory disability in the United States with a correlation coefficient (R) of 0.320 and weighted average of 6.3%, a difference of 6.3%.
Ambulatory Disability Correlation Summary
| Measurement | Icelander | Immigrants from Mexico |
| Minimum | 0.47% | 1.3% |
| Maximum | 16.5% | 26.4% |
| Range | 16.1% | 25.1% |
| Mean | 6.9% | 6.9% |
| Median | 5.6% | 6.2% |
| Interquartile 25% (IQ1) | 4.6% | 5.5% |
| Interquartile 75% (IQ3) | 8.4% | 6.8% |
| Interquartile Range (IQR) | 3.8% | 1.3% |
| Standard Deviation (Sample) | 3.7% | 3.3% |
| Standard Deviation (Population) | 3.7% | 3.3% |
Similar Demographics by Ambulatory Disability
Demographics Similar to Icelanders by Ambulatory Disability
In terms of ambulatory disability, the demographic groups most similar to Icelanders are Costa Rican (5.9%, a difference of 0.0%), Immigrants from Russia (5.9%, a difference of 0.020%), Immigrants from Middle Africa (5.9%, a difference of 0.060%), Estonian (5.9%, a difference of 0.070%), and Norwegian (5.9%, a difference of 0.11%).
| Demographics | Rating | Rank | Ambulatory Disability |
| South American Indians | 94.8 /100 | #115 | Exceptional 5.9% |
| Immigrants | Africa | 94.7 /100 | #116 | Exceptional 5.9% |
| Immigrants | South Eastern Asia | 93.6 /100 | #117 | Exceptional 5.9% |
| Russians | 93.4 /100 | #118 | Exceptional 5.9% |
| Norwegians | 93.1 /100 | #119 | Exceptional 5.9% |
| Estonians | 92.9 /100 | #120 | Exceptional 5.9% |
| Costa Ricans | 92.6 /100 | #121 | Exceptional 5.9% |
| Icelanders | 92.6 /100 | #122 | Exceptional 5.9% |
| Immigrants | Russia | 92.4 /100 | #123 | Exceptional 5.9% |
| Immigrants | Middle Africa | 92.2 /100 | #124 | Exceptional 5.9% |
| Koreans | 91.6 /100 | #125 | Exceptional 5.9% |
| Arabs | 91.5 /100 | #126 | Exceptional 5.9% |
| Immigrants | Nigeria | 90.9 /100 | #127 | Exceptional 5.9% |
| Immigrants | Western Asia | 90.7 /100 | #128 | Exceptional 5.9% |
| Immigrants | Norway | 90.5 /100 | #129 | Exceptional 5.9% |
Demographics Similar to Immigrants from Mexico by Ambulatory Disability
In terms of ambulatory disability, the demographic groups most similar to Immigrants from Mexico are Immigrants from Latin America (6.3%, a difference of 0.010%), Canadian (6.3%, a difference of 0.020%), Yugoslavian (6.3%, a difference of 0.020%), Guamanian/Chamorro (6.3%, a difference of 0.060%), and Mexican American Indian (6.3%, a difference of 0.12%).
| Demographics | Rating | Rank | Ambulatory Disability |
| Alsatians | 15.1 /100 | #207 | Poor 6.3% |
| Bangladeshis | 14.2 /100 | #208 | Poor 6.3% |
| Immigrants | Iraq | 14.0 /100 | #209 | Poor 6.3% |
| Immigrants | Laos | 13.2 /100 | #210 | Poor 6.3% |
| Samoans | 12.1 /100 | #211 | Poor 6.3% |
| Mexican American Indians | 12.0 /100 | #212 | Poor 6.3% |
| Japanese | 12.0 /100 | #213 | Poor 6.3% |
| Immigrants | Mexico | 11.0 /100 | #214 | Poor 6.3% |
| Immigrants | Latin America | 11.0 /100 | #215 | Poor 6.3% |
| Canadians | 10.9 /100 | #216 | Poor 6.3% |
| Yugoslavians | 10.9 /100 | #217 | Poor 6.3% |
| Guamanians/Chamorros | 10.6 /100 | #218 | Poor 6.3% |
| Indonesians | 9.9 /100 | #219 | Tragic 6.3% |
| Immigrants | Albania | 9.6 /100 | #220 | Tragic 6.3% |
| Hungarians | 9.6 /100 | #221 | Tragic 6.3% |