Icelander vs Immigrants from South Africa Ambulatory Disability
COMPARE
Icelander
Immigrants from South Africa
Ambulatory Disability
Ambulatory Disability Comparison
Icelanders
Immigrants from South Africa
5.9%
AMBULATORY DISABILITY
92.6/ 100
METRIC RATING
122nd/ 347
METRIC RANK
5.7%
AMBULATORY DISABILITY
99.3/ 100
METRIC RATING
75th/ 347
METRIC RANK
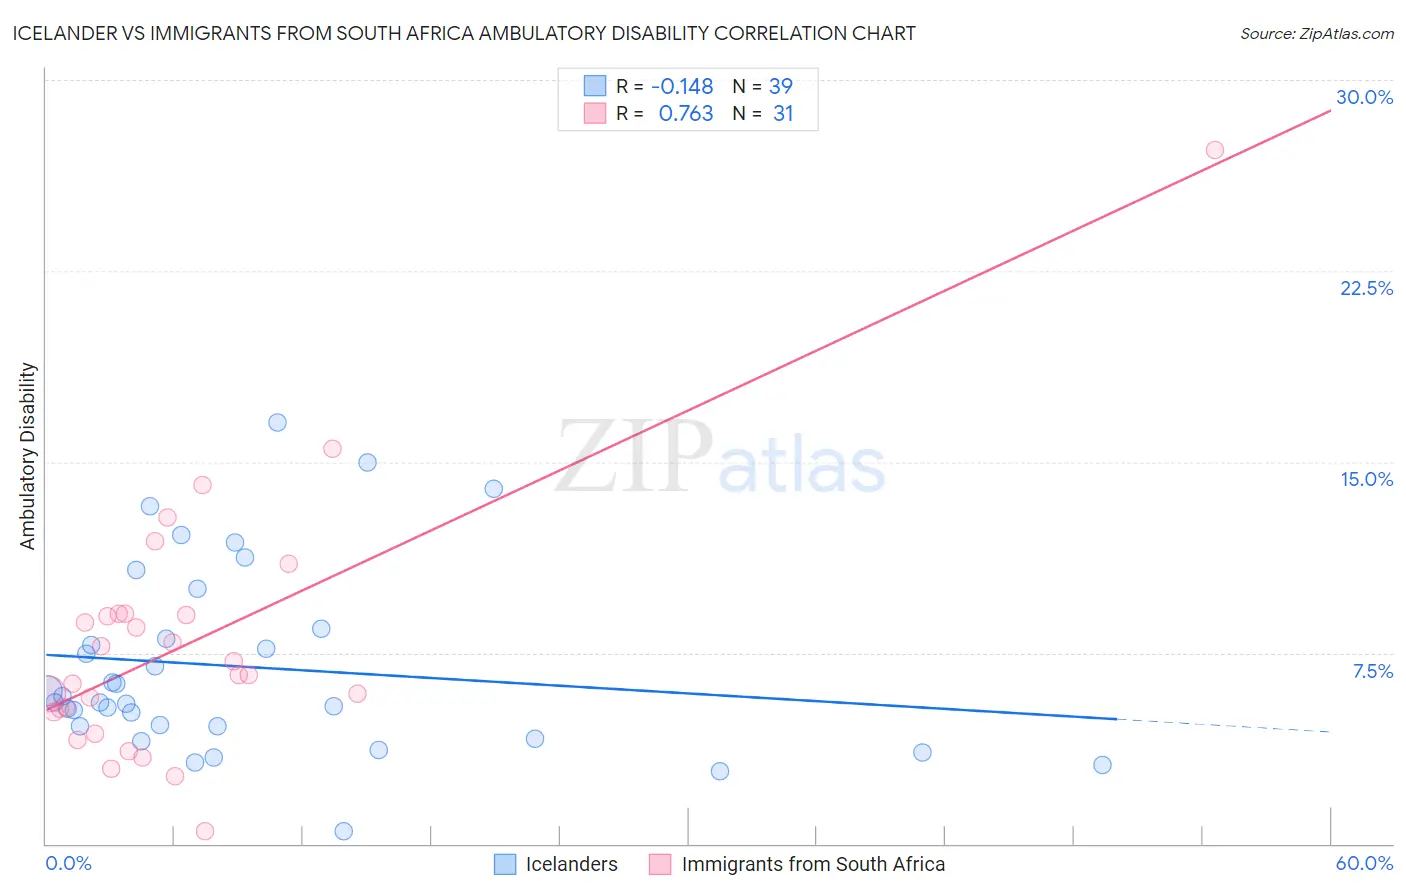
Icelander vs Immigrants from South Africa Ambulatory Disability Correlation Chart
The statistical analysis conducted on geographies consisting of 159,642,692 people shows a poor negative correlation between the proportion of Icelanders and percentage of population with ambulatory disability in the United States with a correlation coefficient (R) of -0.148 and weighted average of 5.9%. Similarly, the statistical analysis conducted on geographies consisting of 233,268,950 people shows a strong positive correlation between the proportion of Immigrants from South Africa and percentage of population with ambulatory disability in the United States with a correlation coefficient (R) of 0.763 and weighted average of 5.7%, a difference of 3.6%.
Ambulatory Disability Correlation Summary
| Measurement | Icelander | Immigrants from South Africa |
| Minimum | 0.47% | 0.47% |
| Maximum | 16.5% | 27.3% |
| Range | 16.1% | 26.8% |
| Mean | 6.9% | 7.8% |
| Median | 5.6% | 6.6% |
| Interquartile 25% (IQ1) | 4.6% | 5.2% |
| Interquartile 75% (IQ3) | 8.4% | 9.0% |
| Interquartile Range (IQR) | 3.8% | 3.8% |
| Standard Deviation (Sample) | 3.7% | 5.0% |
| Standard Deviation (Population) | 3.7% | 4.9% |
Similar Demographics by Ambulatory Disability
Demographics Similar to Icelanders by Ambulatory Disability
In terms of ambulatory disability, the demographic groups most similar to Icelanders are Costa Rican (5.9%, a difference of 0.0%), Immigrants from Russia (5.9%, a difference of 0.020%), Immigrants from Middle Africa (5.9%, a difference of 0.060%), Estonian (5.9%, a difference of 0.070%), and Norwegian (5.9%, a difference of 0.11%).
| Demographics | Rating | Rank | Ambulatory Disability |
| South American Indians | 94.8 /100 | #115 | Exceptional 5.9% |
| Immigrants | Africa | 94.7 /100 | #116 | Exceptional 5.9% |
| Immigrants | South Eastern Asia | 93.6 /100 | #117 | Exceptional 5.9% |
| Russians | 93.4 /100 | #118 | Exceptional 5.9% |
| Norwegians | 93.1 /100 | #119 | Exceptional 5.9% |
| Estonians | 92.9 /100 | #120 | Exceptional 5.9% |
| Costa Ricans | 92.6 /100 | #121 | Exceptional 5.9% |
| Icelanders | 92.6 /100 | #122 | Exceptional 5.9% |
| Immigrants | Russia | 92.4 /100 | #123 | Exceptional 5.9% |
| Immigrants | Middle Africa | 92.2 /100 | #124 | Exceptional 5.9% |
| Koreans | 91.6 /100 | #125 | Exceptional 5.9% |
| Arabs | 91.5 /100 | #126 | Exceptional 5.9% |
| Immigrants | Nigeria | 90.9 /100 | #127 | Exceptional 5.9% |
| Immigrants | Western Asia | 90.7 /100 | #128 | Exceptional 5.9% |
| Immigrants | Norway | 90.5 /100 | #129 | Exceptional 5.9% |
Demographics Similar to Immigrants from South Africa by Ambulatory Disability
In terms of ambulatory disability, the demographic groups most similar to Immigrants from South Africa are Sudanese (5.7%, a difference of 0.020%), Immigrants from Cameroon (5.7%, a difference of 0.050%), Immigrants from Northern Africa (5.7%, a difference of 0.060%), Brazilian (5.7%, a difference of 0.070%), and Immigrants from Peru (5.7%, a difference of 0.090%).
| Demographics | Rating | Rank | Ambulatory Disability |
| Sri Lankans | 99.6 /100 | #68 | Exceptional 5.7% |
| Peruvians | 99.5 /100 | #69 | Exceptional 5.7% |
| Sierra Leoneans | 99.4 /100 | #70 | Exceptional 5.7% |
| Immigrants | Peru | 99.4 /100 | #71 | Exceptional 5.7% |
| Brazilians | 99.4 /100 | #72 | Exceptional 5.7% |
| Immigrants | Northern Africa | 99.4 /100 | #73 | Exceptional 5.7% |
| Immigrants | Cameroon | 99.4 /100 | #74 | Exceptional 5.7% |
| Immigrants | South Africa | 99.3 /100 | #75 | Exceptional 5.7% |
| Sudanese | 99.3 /100 | #76 | Exceptional 5.7% |
| Immigrants | Vietnam | 99.3 /100 | #77 | Exceptional 5.7% |
| Somalis | 99.2 /100 | #78 | Exceptional 5.7% |
| Chileans | 99.2 /100 | #79 | Exceptional 5.7% |
| Immigrants | Ireland | 99.2 /100 | #80 | Exceptional 5.7% |
| Immigrants | Jordan | 99.2 /100 | #81 | Exceptional 5.7% |
| Palestinians | 99.2 /100 | #82 | Exceptional 5.7% |