Chilean vs Immigrants from Mexico Ambulatory Disability
COMPARE
Chilean
Immigrants from Mexico
Ambulatory Disability
Ambulatory Disability Comparison
Chileans
Immigrants from Mexico
5.7%
AMBULATORY DISABILITY
99.2/ 100
METRIC RATING
79th/ 347
METRIC RANK
6.3%
AMBULATORY DISABILITY
11.0/ 100
METRIC RATING
214th/ 347
METRIC RANK
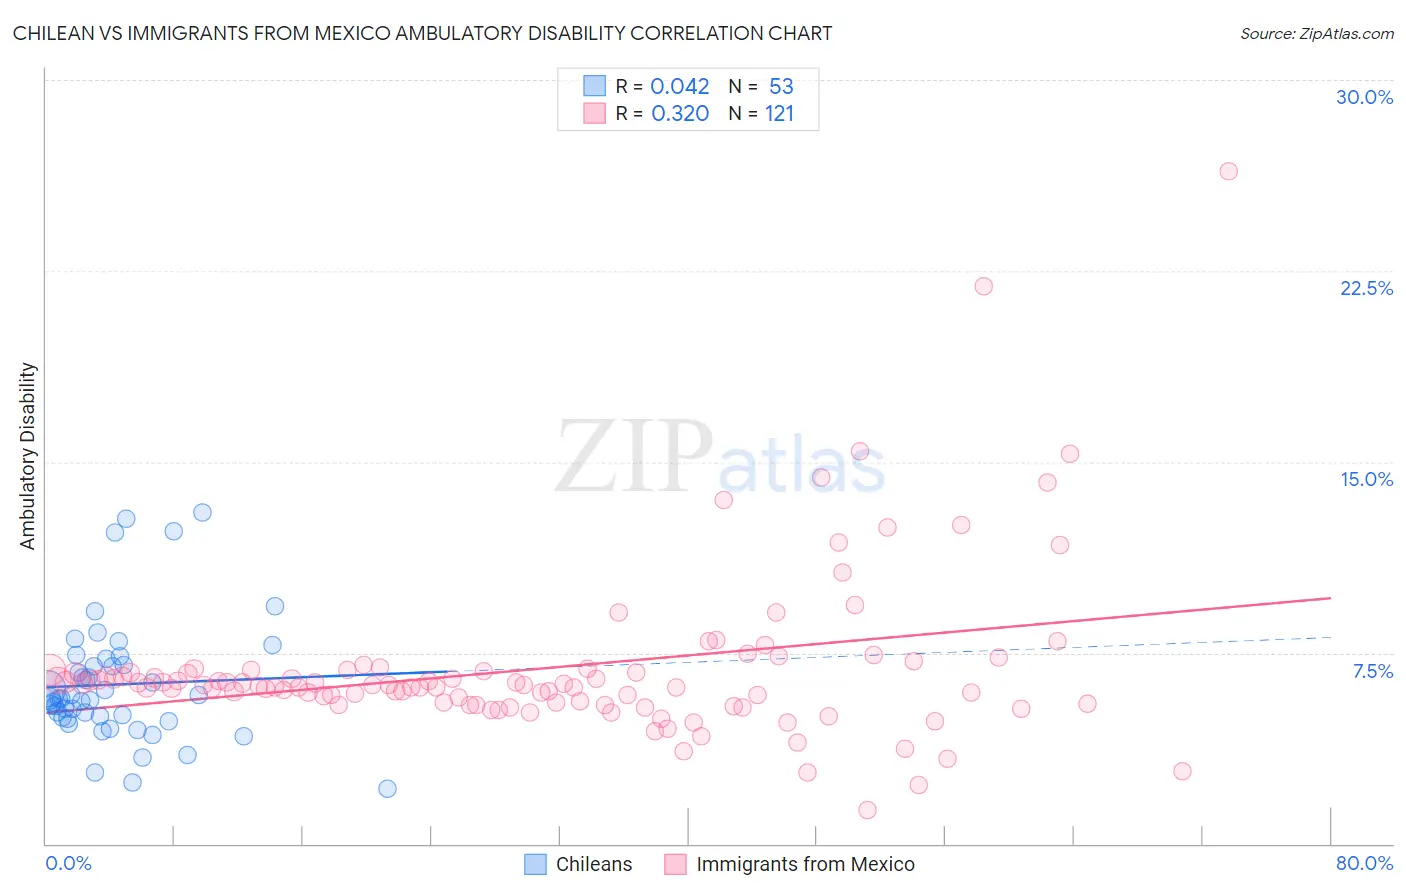
Chilean vs Immigrants from Mexico Ambulatory Disability Correlation Chart
The statistical analysis conducted on geographies consisting of 256,632,151 people shows no correlation between the proportion of Chileans and percentage of population with ambulatory disability in the United States with a correlation coefficient (R) of 0.042 and weighted average of 5.7%. Similarly, the statistical analysis conducted on geographies consisting of 513,370,670 people shows a mild positive correlation between the proportion of Immigrants from Mexico and percentage of population with ambulatory disability in the United States with a correlation coefficient (R) of 0.320 and weighted average of 6.3%, a difference of 9.9%.
Ambulatory Disability Correlation Summary
| Measurement | Chilean | Immigrants from Mexico |
| Minimum | 2.1% | 1.3% |
| Maximum | 13.0% | 26.4% |
| Range | 10.9% | 25.1% |
| Mean | 6.3% | 6.9% |
| Median | 5.7% | 6.2% |
| Interquartile 25% (IQ1) | 4.9% | 5.5% |
| Interquartile 75% (IQ3) | 7.2% | 6.8% |
| Interquartile Range (IQR) | 2.2% | 1.3% |
| Standard Deviation (Sample) | 2.4% | 3.3% |
| Standard Deviation (Population) | 2.3% | 3.3% |
Similar Demographics by Ambulatory Disability
Demographics Similar to Chileans by Ambulatory Disability
In terms of ambulatory disability, the demographic groups most similar to Chileans are Somali (5.7%, a difference of 0.010%), Immigrants from Vietnam (5.7%, a difference of 0.020%), Immigrants from Ireland (5.7%, a difference of 0.13%), Immigrants from Jordan (5.7%, a difference of 0.14%), and Palestinian (5.7%, a difference of 0.14%).
| Demographics | Rating | Rank | Ambulatory Disability |
| Brazilians | 99.4 /100 | #72 | Exceptional 5.7% |
| Immigrants | Northern Africa | 99.4 /100 | #73 | Exceptional 5.7% |
| Immigrants | Cameroon | 99.4 /100 | #74 | Exceptional 5.7% |
| Immigrants | South Africa | 99.3 /100 | #75 | Exceptional 5.7% |
| Sudanese | 99.3 /100 | #76 | Exceptional 5.7% |
| Immigrants | Vietnam | 99.3 /100 | #77 | Exceptional 5.7% |
| Somalis | 99.2 /100 | #78 | Exceptional 5.7% |
| Chileans | 99.2 /100 | #79 | Exceptional 5.7% |
| Immigrants | Ireland | 99.2 /100 | #80 | Exceptional 5.7% |
| Immigrants | Jordan | 99.2 /100 | #81 | Exceptional 5.7% |
| Palestinians | 99.2 /100 | #82 | Exceptional 5.7% |
| Eastern Europeans | 99.2 /100 | #83 | Exceptional 5.7% |
| Ugandans | 99.2 /100 | #84 | Exceptional 5.7% |
| South Americans | 99.0 /100 | #85 | Exceptional 5.7% |
| Latvians | 99.0 /100 | #86 | Exceptional 5.7% |
Demographics Similar to Immigrants from Mexico by Ambulatory Disability
In terms of ambulatory disability, the demographic groups most similar to Immigrants from Mexico are Immigrants from Latin America (6.3%, a difference of 0.010%), Canadian (6.3%, a difference of 0.020%), Yugoslavian (6.3%, a difference of 0.020%), Guamanian/Chamorro (6.3%, a difference of 0.060%), and Mexican American Indian (6.3%, a difference of 0.12%).
| Demographics | Rating | Rank | Ambulatory Disability |
| Alsatians | 15.1 /100 | #207 | Poor 6.3% |
| Bangladeshis | 14.2 /100 | #208 | Poor 6.3% |
| Immigrants | Iraq | 14.0 /100 | #209 | Poor 6.3% |
| Immigrants | Laos | 13.2 /100 | #210 | Poor 6.3% |
| Samoans | 12.1 /100 | #211 | Poor 6.3% |
| Mexican American Indians | 12.0 /100 | #212 | Poor 6.3% |
| Japanese | 12.0 /100 | #213 | Poor 6.3% |
| Immigrants | Mexico | 11.0 /100 | #214 | Poor 6.3% |
| Immigrants | Latin America | 11.0 /100 | #215 | Poor 6.3% |
| Canadians | 10.9 /100 | #216 | Poor 6.3% |
| Yugoslavians | 10.9 /100 | #217 | Poor 6.3% |
| Guamanians/Chamorros | 10.6 /100 | #218 | Poor 6.3% |
| Indonesians | 9.9 /100 | #219 | Tragic 6.3% |
| Immigrants | Albania | 9.6 /100 | #220 | Tragic 6.3% |
| Hungarians | 9.6 /100 | #221 | Tragic 6.3% |