Greek vs Bermudan Male Disability
COMPARE
Greek
Bermudan
Male Disability
Male Disability Comparison
Greeks
Bermudans
11.4%
MALE DISABILITY
22.2/ 100
METRIC RATING
193rd/ 347
METRIC RANK
11.8%
MALE DISABILITY
2.3/ 100
METRIC RATING
229th/ 347
METRIC RANK
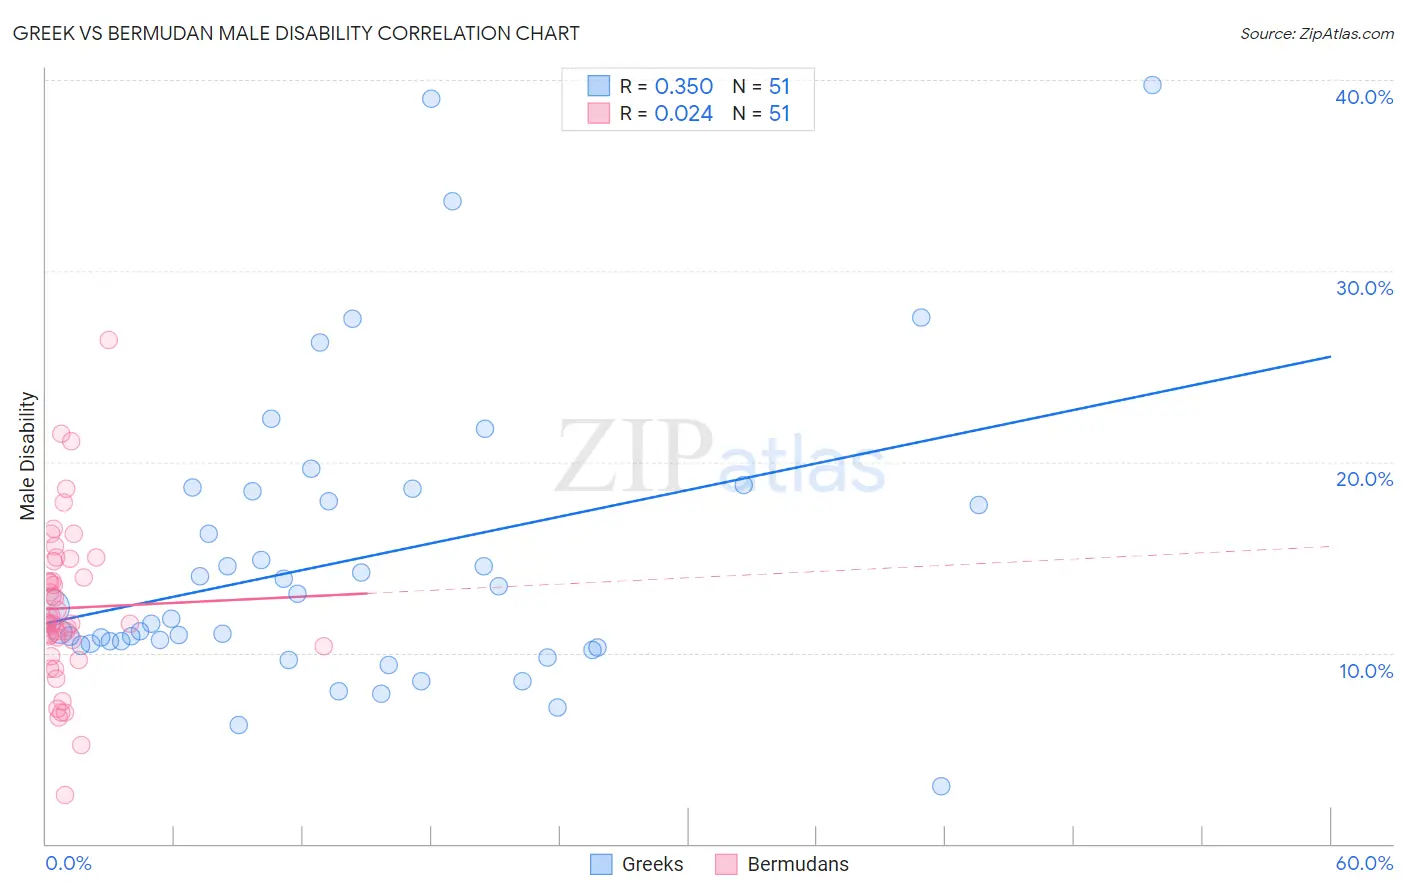
Greek vs Bermudan Male Disability Correlation Chart
The statistical analysis conducted on geographies consisting of 482,664,692 people shows a mild positive correlation between the proportion of Greeks and percentage of males with a disability in the United States with a correlation coefficient (R) of 0.350 and weighted average of 11.4%. Similarly, the statistical analysis conducted on geographies consisting of 55,719,731 people shows no correlation between the proportion of Bermudans and percentage of males with a disability in the United States with a correlation coefficient (R) of 0.024 and weighted average of 11.8%, a difference of 3.4%.
Male Disability Correlation Summary
| Measurement | Greek | Bermudan |
| Minimum | 3.0% | 2.5% |
| Maximum | 39.7% | 26.4% |
| Range | 36.7% | 23.9% |
| Mean | 14.9% | 12.3% |
| Median | 11.8% | 11.5% |
| Interquartile 25% (IQ1) | 10.4% | 10.3% |
| Interquartile 75% (IQ3) | 18.5% | 14.8% |
| Interquartile Range (IQR) | 8.1% | 4.5% |
| Standard Deviation (Sample) | 7.8% | 4.2% |
| Standard Deviation (Population) | 7.7% | 4.2% |
Similar Demographics by Male Disability
Demographics Similar to Greeks by Male Disability
In terms of male disability, the demographic groups most similar to Greeks are Assyrian/Chaldean/Syriac (11.4%, a difference of 0.070%), Senegalese (11.4%, a difference of 0.080%), Belizean (11.4%, a difference of 0.080%), Immigrants from Oceania (11.4%, a difference of 0.11%), and Immigrants from Bosnia and Herzegovina (11.4%, a difference of 0.24%).
| Demographics | Rating | Rank | Male Disability |
| Immigrants | Zaire | 27.6 /100 | #186 | Fair 11.4% |
| Immigrants | Austria | 27.3 /100 | #187 | Fair 11.4% |
| Estonians | 26.8 /100 | #188 | Fair 11.4% |
| Immigrants | Netherlands | 25.9 /100 | #189 | Fair 11.4% |
| Immigrants | Bosnia and Herzegovina | 25.4 /100 | #190 | Fair 11.4% |
| Senegalese | 23.2 /100 | #191 | Fair 11.4% |
| Assyrians/Chaldeans/Syriacs | 23.2 /100 | #192 | Fair 11.4% |
| Greeks | 22.2 /100 | #193 | Fair 11.4% |
| Belizeans | 21.2 /100 | #194 | Fair 11.4% |
| Immigrants | Oceania | 20.9 /100 | #195 | Fair 11.4% |
| West Indians | 18.4 /100 | #196 | Poor 11.4% |
| Somalis | 18.2 /100 | #197 | Poor 11.4% |
| Immigrants | Jamaica | 16.3 /100 | #198 | Poor 11.5% |
| Lebanese | 15.4 /100 | #199 | Poor 11.5% |
| Immigrants | Iraq | 13.0 /100 | #200 | Poor 11.5% |
Demographics Similar to Bermudans by Male Disability
In terms of male disability, the demographic groups most similar to Bermudans are Hispanic or Latino (11.8%, a difference of 0.030%), Croatian (11.8%, a difference of 0.090%), Austrian (11.8%, a difference of 0.11%), Dominican (11.8%, a difference of 0.28%), and Subsaharan African (11.8%, a difference of 0.29%).
| Demographics | Rating | Rank | Male Disability |
| Alsatians | 3.3 /100 | #222 | Tragic 11.7% |
| Immigrants | Bahamas | 3.2 /100 | #223 | Tragic 11.7% |
| Japanese | 3.1 /100 | #224 | Tragic 11.7% |
| Liberians | 3.1 /100 | #225 | Tragic 11.8% |
| Sub-Saharan Africans | 2.8 /100 | #226 | Tragic 11.8% |
| Austrians | 2.5 /100 | #227 | Tragic 11.8% |
| Hispanics or Latinos | 2.3 /100 | #228 | Tragic 11.8% |
| Bermudans | 2.3 /100 | #229 | Tragic 11.8% |
| Croatians | 2.1 /100 | #230 | Tragic 11.8% |
| Dominicans | 1.8 /100 | #231 | Tragic 11.8% |
| Malaysians | 1.8 /100 | #232 | Tragic 11.8% |
| Mexicans | 1.7 /100 | #233 | Tragic 11.8% |
| Immigrants | Canada | 1.6 /100 | #234 | Tragic 11.9% |
| Immigrants | North America | 1.5 /100 | #235 | Tragic 11.9% |
| U.S. Virgin Islanders | 1.3 /100 | #236 | Tragic 11.9% |