Greek vs Bermudan High School Diploma
COMPARE
Greek
Bermudan
High School Diploma
High School Diploma Comparison
Greeks
Bermudans
91.2%
HIGH SCHOOL DIPLOMA
99.8/ 100
METRIC RATING
46th/ 347
METRIC RANK
89.3%
HIGH SCHOOL DIPLOMA
61.1/ 100
METRIC RATING
162nd/ 347
METRIC RANK
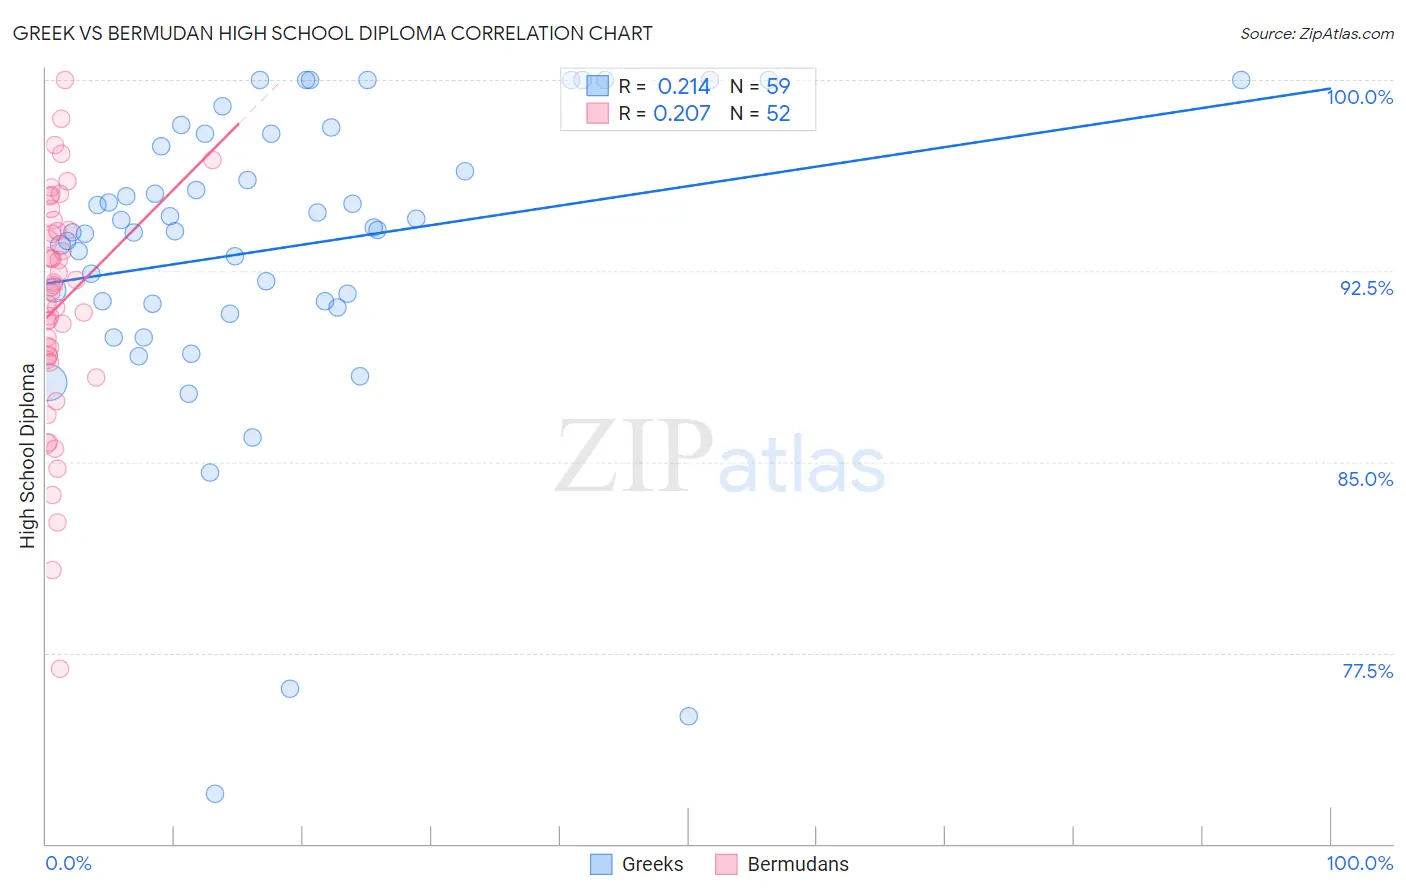
Greek vs Bermudan High School Diploma Correlation Chart
The statistical analysis conducted on geographies consisting of 482,775,362 people shows a weak positive correlation between the proportion of Greeks and percentage of population with at least high school diploma education in the United States with a correlation coefficient (R) of 0.214 and weighted average of 91.2%. Similarly, the statistical analysis conducted on geographies consisting of 55,730,379 people shows a weak positive correlation between the proportion of Bermudans and percentage of population with at least high school diploma education in the United States with a correlation coefficient (R) of 0.207 and weighted average of 89.3%, a difference of 2.1%.
High School Diploma Correlation Summary
| Measurement | Greek | Bermudan |
| Minimum | 72.0% | 76.9% |
| Maximum | 100.0% | 100.0% |
| Range | 28.0% | 23.1% |
| Mean | 93.4% | 91.1% |
| Median | 94.1% | 91.7% |
| Interquartile 25% (IQ1) | 91.2% | 89.1% |
| Interquartile 75% (IQ3) | 97.9% | 94.1% |
| Interquartile Range (IQR) | 6.7% | 5.0% |
| Standard Deviation (Sample) | 5.9% | 4.6% |
| Standard Deviation (Population) | 5.9% | 4.5% |
Similar Demographics by High School Diploma
Demographics Similar to Greeks by High School Diploma
In terms of high school diploma, the demographic groups most similar to Greeks are Australian (91.2%, a difference of 0.010%), Belgian (91.2%, a difference of 0.020%), Bhutanese (91.2%, a difference of 0.020%), Turkish (91.2%, a difference of 0.030%), and Immigrants from Austria (91.3%, a difference of 0.040%).
| Demographics | Rating | Rank | High School Diploma |
| Dutch | 99.8 /100 | #39 | Exceptional 91.3% |
| Immigrants | Lithuania | 99.8 /100 | #40 | Exceptional 91.3% |
| Immigrants | Australia | 99.8 /100 | #41 | Exceptional 91.3% |
| Northern Europeans | 99.8 /100 | #42 | Exceptional 91.3% |
| British | 99.8 /100 | #43 | Exceptional 91.3% |
| Immigrants | Austria | 99.8 /100 | #44 | Exceptional 91.3% |
| Turks | 99.8 /100 | #45 | Exceptional 91.2% |
| Greeks | 99.8 /100 | #46 | Exceptional 91.2% |
| Australians | 99.8 /100 | #47 | Exceptional 91.2% |
| Belgians | 99.8 /100 | #48 | Exceptional 91.2% |
| Bhutanese | 99.8 /100 | #49 | Exceptional 91.2% |
| Welsh | 99.8 /100 | #50 | Exceptional 91.2% |
| New Zealanders | 99.7 /100 | #51 | Exceptional 91.1% |
| Immigrants | Sweden | 99.7 /100 | #52 | Exceptional 91.1% |
| Immigrants | Belgium | 99.7 /100 | #53 | Exceptional 91.1% |
Demographics Similar to Bermudans by High School Diploma
In terms of high school diploma, the demographic groups most similar to Bermudans are Brazilian (89.3%, a difference of 0.0%), Cree (89.3%, a difference of 0.0%), Immigrants from Nepal (89.3%, a difference of 0.0%), Immigrants from China (89.3%, a difference of 0.010%), and Laotian (89.3%, a difference of 0.010%).
| Demographics | Rating | Rank | High School Diploma |
| Immigrants | Northern Africa | 66.4 /100 | #155 | Good 89.4% |
| Immigrants | Argentina | 65.5 /100 | #156 | Good 89.4% |
| Immigrants | Malaysia | 63.5 /100 | #157 | Good 89.3% |
| Immigrants | Pakistan | 62.5 /100 | #158 | Good 89.3% |
| Immigrants | China | 62.0 /100 | #159 | Good 89.3% |
| Laotians | 61.8 /100 | #160 | Good 89.3% |
| Brazilians | 61.2 /100 | #161 | Good 89.3% |
| Bermudans | 61.1 /100 | #162 | Good 89.3% |
| Cree | 61.1 /100 | #163 | Good 89.3% |
| Immigrants | Nepal | 61.1 /100 | #164 | Good 89.3% |
| Immigrants | Asia | 59.8 /100 | #165 | Average 89.3% |
| Immigrants | Albania | 59.4 /100 | #166 | Average 89.3% |
| Immigrants | Hong Kong | 58.6 /100 | #167 | Average 89.3% |
| Delaware | 55.8 /100 | #168 | Average 89.2% |
| Iroquois | 55.1 /100 | #169 | Average 89.2% |