French American Indian vs Canadian Self-Care Disability
COMPARE
French American Indian
Canadian
Self-Care Disability
Self-Care Disability Comparison
French American Indians
Canadians
2.7%
SELF-CARE DISABILITY
0.0/ 100
METRIC RATING
286th/ 347
METRIC RANK
2.5%
SELF-CARE DISABILITY
58.8/ 100
METRIC RATING
166th/ 347
METRIC RANK
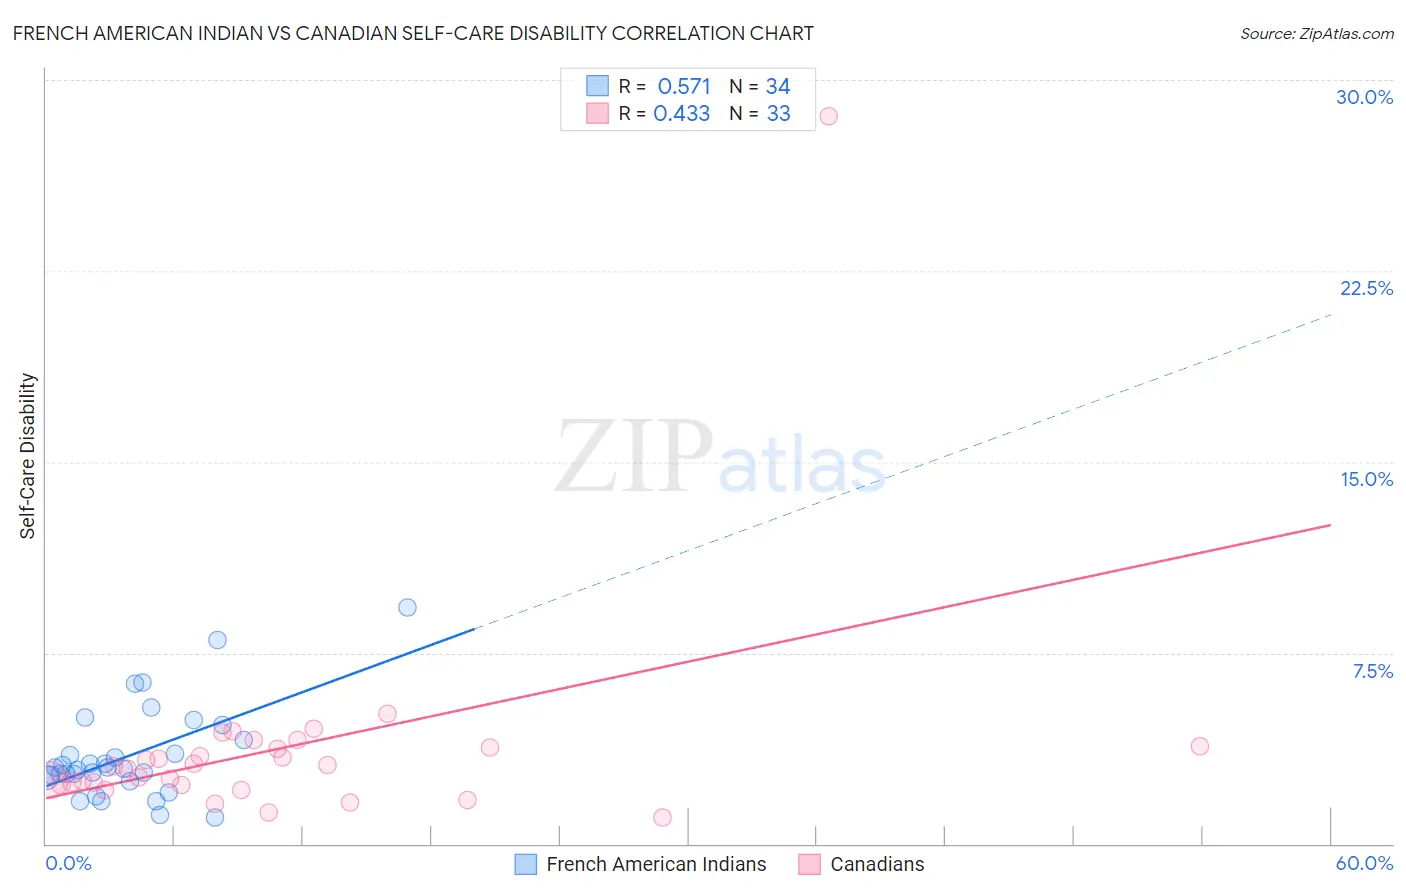
French American Indian vs Canadian Self-Care Disability Correlation Chart
The statistical analysis conducted on geographies consisting of 131,926,488 people shows a substantial positive correlation between the proportion of French American Indians and percentage of population with self-care disability in the United States with a correlation coefficient (R) of 0.571 and weighted average of 2.7%. Similarly, the statistical analysis conducted on geographies consisting of 436,894,568 people shows a moderate positive correlation between the proportion of Canadians and percentage of population with self-care disability in the United States with a correlation coefficient (R) of 0.433 and weighted average of 2.5%, a difference of 10.5%.
Self-Care Disability Correlation Summary
| Measurement | French American Indian | Canadian |
| Minimum | 1.0% | 1.1% |
| Maximum | 9.3% | 28.6% |
| Range | 8.2% | 27.5% |
| Mean | 3.5% | 3.7% |
| Median | 3.0% | 3.0% |
| Interquartile 25% (IQ1) | 2.6% | 2.3% |
| Interquartile 75% (IQ3) | 4.1% | 3.8% |
| Interquartile Range (IQR) | 1.5% | 1.5% |
| Standard Deviation (Sample) | 1.8% | 4.6% |
| Standard Deviation (Population) | 1.8% | 4.5% |
Similar Demographics by Self-Care Disability
Demographics Similar to French American Indians by Self-Care Disability
In terms of self-care disability, the demographic groups most similar to French American Indians are Immigrants from Jamaica (2.7%, a difference of 0.33%), Immigrants from Barbados (2.7%, a difference of 0.37%), African (2.7%, a difference of 0.47%), Jamaican (2.7%, a difference of 0.60%), and Cuban (2.7%, a difference of 0.62%).
| Demographics | Rating | Rank | Self-Care Disability |
| Iroquois | 0.1 /100 | #279 | Tragic 2.7% |
| Hispanics or Latinos | 0.1 /100 | #280 | Tragic 2.7% |
| Immigrants | Iraq | 0.0 /100 | #281 | Tragic 2.7% |
| Apache | 0.0 /100 | #282 | Tragic 2.7% |
| Delaware | 0.0 /100 | #283 | Tragic 2.7% |
| Fijians | 0.0 /100 | #284 | Tragic 2.7% |
| Jamaicans | 0.0 /100 | #285 | Tragic 2.7% |
| French American Indians | 0.0 /100 | #286 | Tragic 2.7% |
| Immigrants | Jamaica | 0.0 /100 | #287 | Tragic 2.7% |
| Immigrants | Barbados | 0.0 /100 | #288 | Tragic 2.7% |
| Africans | 0.0 /100 | #289 | Tragic 2.7% |
| Cubans | 0.0 /100 | #290 | Tragic 2.7% |
| Guyanese | 0.0 /100 | #291 | Tragic 2.7% |
| Central American Indians | 0.0 /100 | #292 | Tragic 2.7% |
| Belizeans | 0.0 /100 | #293 | Tragic 2.7% |
Demographics Similar to Canadians by Self-Care Disability
In terms of self-care disability, the demographic groups most similar to Canadians are Syrian (2.5%, a difference of 0.010%), Immigrants from Vietnam (2.5%, a difference of 0.030%), Immigrants from Greece (2.5%, a difference of 0.070%), Ute (2.5%, a difference of 0.080%), and Immigrants from Somalia (2.5%, a difference of 0.14%).
| Demographics | Rating | Rank | Self-Care Disability |
| Immigrants | Italy | 68.5 /100 | #159 | Good 2.4% |
| Finns | 67.0 /100 | #160 | Good 2.4% |
| Lebanese | 66.5 /100 | #161 | Good 2.4% |
| Somalis | 63.7 /100 | #162 | Good 2.5% |
| German Russians | 62.7 /100 | #163 | Good 2.5% |
| Immigrants | Vietnam | 59.3 /100 | #164 | Average 2.5% |
| Syrians | 59.0 /100 | #165 | Average 2.5% |
| Canadians | 58.8 /100 | #166 | Average 2.5% |
| Immigrants | Greece | 57.3 /100 | #167 | Average 2.5% |
| Ute | 57.1 /100 | #168 | Average 2.5% |
| Immigrants | Somalia | 55.9 /100 | #169 | Average 2.5% |
| Scottish | 54.3 /100 | #170 | Average 2.5% |
| Pennsylvania Germans | 53.5 /100 | #171 | Average 2.5% |
| Czechoslovakians | 53.5 /100 | #172 | Average 2.5% |
| Immigrants | Burma/Myanmar | 52.8 /100 | #173 | Average 2.5% |