Egyptian vs Immigrants from Mexico Female Disability
COMPARE
Egyptian
Immigrants from Mexico
Female Disability
Female Disability Comparison
Egyptians
Immigrants from Mexico
11.1%
FEMALE DISABILITY
100.0/ 100
METRIC RATING
28th/ 347
METRIC RANK
12.2%
FEMALE DISABILITY
50.8/ 100
METRIC RATING
173rd/ 347
METRIC RANK
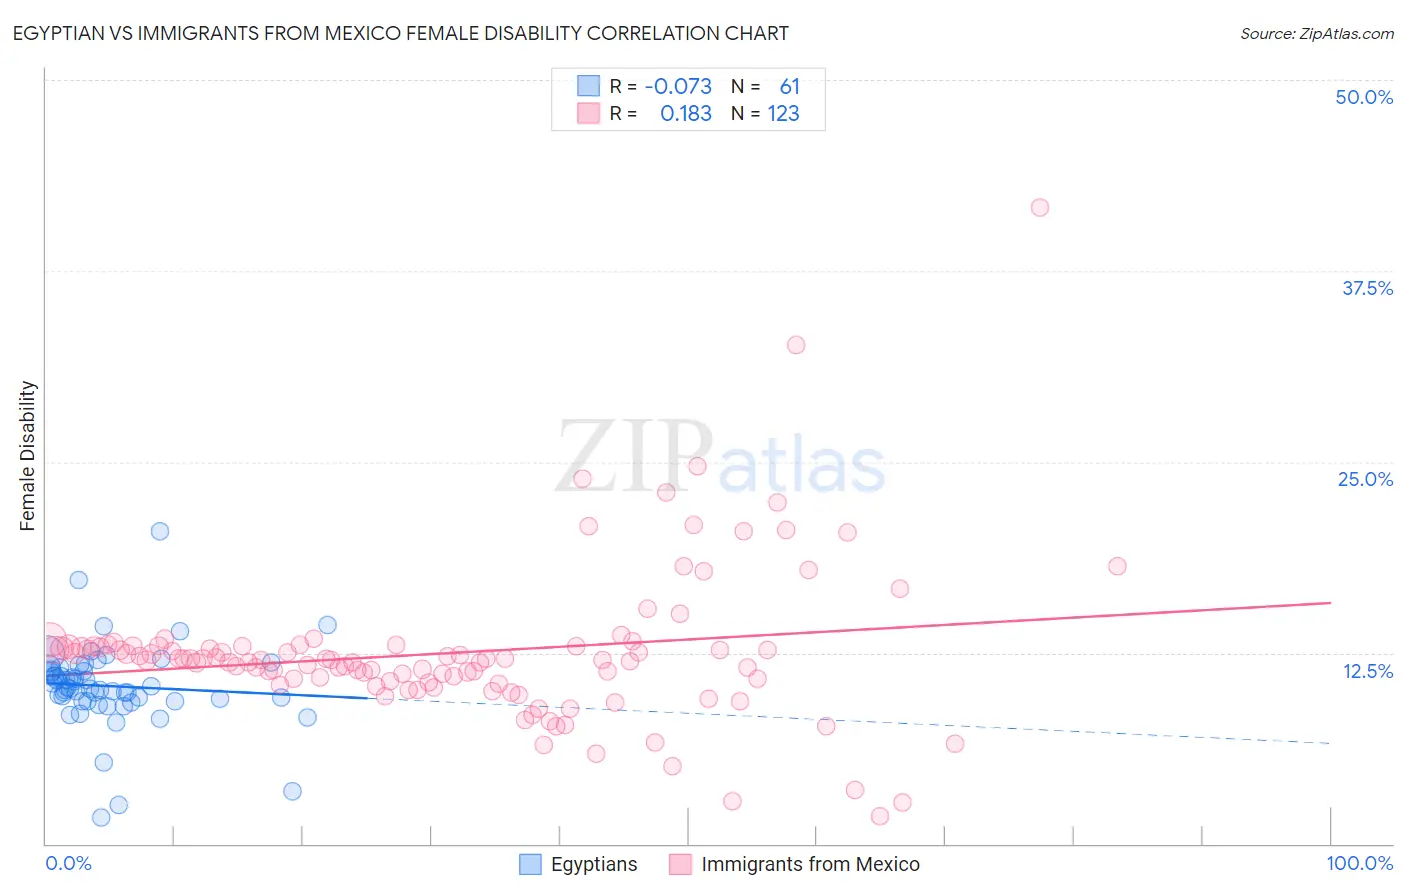
Egyptian vs Immigrants from Mexico Female Disability Correlation Chart
The statistical analysis conducted on geographies consisting of 276,904,353 people shows a slight negative correlation between the proportion of Egyptians and percentage of females with a disability in the United States with a correlation coefficient (R) of -0.073 and weighted average of 11.1%. Similarly, the statistical analysis conducted on geographies consisting of 513,519,603 people shows a poor positive correlation between the proportion of Immigrants from Mexico and percentage of females with a disability in the United States with a correlation coefficient (R) of 0.183 and weighted average of 12.2%, a difference of 9.9%.
Female Disability Correlation Summary
| Measurement | Egyptian | Immigrants from Mexico |
| Minimum | 1.7% | 1.8% |
| Maximum | 20.5% | 41.7% |
| Range | 18.8% | 39.9% |
| Mean | 10.3% | 12.5% |
| Median | 10.2% | 12.1% |
| Interquartile 25% (IQ1) | 9.3% | 10.6% |
| Interquartile 75% (IQ3) | 11.4% | 12.9% |
| Interquartile Range (IQR) | 2.1% | 2.4% |
| Standard Deviation (Sample) | 2.8% | 5.0% |
| Standard Deviation (Population) | 2.8% | 5.0% |
Similar Demographics by Female Disability
Demographics Similar to Egyptians by Female Disability
In terms of female disability, the demographic groups most similar to Egyptians are Immigrants from Malaysia (11.1%, a difference of 0.060%), Turkish (11.1%, a difference of 0.070%), Immigrants from Kuwait (11.1%, a difference of 0.17%), Immigrants from Turkey (11.1%, a difference of 0.27%), and Immigrants from Australia (11.1%, a difference of 0.33%).
| Demographics | Rating | Rank | Female Disability |
| Asians | 100.0 /100 | #21 | Exceptional 10.9% |
| Immigrants | Sri Lanka | 100.0 /100 | #22 | Exceptional 10.9% |
| Venezuelans | 100.0 /100 | #23 | Exceptional 11.0% |
| Immigrants | Argentina | 100.0 /100 | #24 | Exceptional 11.0% |
| Immigrants | Asia | 100.0 /100 | #25 | Exceptional 11.0% |
| Argentineans | 100.0 /100 | #26 | Exceptional 11.0% |
| Immigrants | Turkey | 100.0 /100 | #27 | Exceptional 11.1% |
| Egyptians | 100.0 /100 | #28 | Exceptional 11.1% |
| Immigrants | Malaysia | 100.0 /100 | #29 | Exceptional 11.1% |
| Turks | 100.0 /100 | #30 | Exceptional 11.1% |
| Immigrants | Kuwait | 100.0 /100 | #31 | Exceptional 11.1% |
| Immigrants | Australia | 100.0 /100 | #32 | Exceptional 11.1% |
| Immigrants | Egypt | 100.0 /100 | #33 | Exceptional 11.1% |
| Immigrants | Indonesia | 100.0 /100 | #34 | Exceptional 11.2% |
| Immigrants | Japan | 100.0 /100 | #35 | Exceptional 11.2% |
Demographics Similar to Immigrants from Mexico by Female Disability
In terms of female disability, the demographic groups most similar to Immigrants from Mexico are Immigrants from England (12.2%, a difference of 0.030%), Haitian (12.2%, a difference of 0.040%), Immigrants from St. Vincent and the Grenadines (12.2%, a difference of 0.040%), Immigrants from Southern Europe (12.2%, a difference of 0.21%), and Maltese (12.2%, a difference of 0.23%).
| Demographics | Rating | Rank | Female Disability |
| Lithuanians | 59.5 /100 | #166 | Average 12.2% |
| Immigrants | Latin America | 59.0 /100 | #167 | Average 12.2% |
| Immigrants | Haiti | 58.8 /100 | #168 | Average 12.2% |
| Lebanese | 58.1 /100 | #169 | Average 12.2% |
| Maltese | 57.0 /100 | #170 | Average 12.2% |
| Immigrants | Southern Europe | 56.3 /100 | #171 | Average 12.2% |
| Haitians | 51.9 /100 | #172 | Average 12.2% |
| Immigrants | Mexico | 50.8 /100 | #173 | Average 12.2% |
| Immigrants | England | 50.0 /100 | #174 | Average 12.2% |
| Immigrants | St. Vincent and the Grenadines | 49.7 /100 | #175 | Average 12.2% |
| Immigrants | Guyana | 43.1 /100 | #176 | Average 12.2% |
| Immigrants | Ghana | 42.5 /100 | #177 | Average 12.2% |
| Immigrants | Western Europe | 40.9 /100 | #178 | Average 12.2% |
| Immigrants | Fiji | 38.2 /100 | #179 | Fair 12.3% |
| Albanians | 37.9 /100 | #180 | Fair 12.3% |